How to Create a Bar Chart in Excel | Graphs & Charts 101
In this tutorial, we learn how to create a chart in Excel from start to finish. We review how to select a data set, and then and customize the chart type, colors, axis titles.
👉 Check out my courses to help you master Excel in a weekend: https://www.ericandrewsstartups.com/courses
🚀 If you want to master the finance skills & frameworks to successfully scale technology startups, secure your spot in my "Finance for Startups" program, today: https://www.ericandrewsstartups.com/financeforstartups
Communities:
💼 Linkedin: https://www.linkedin.com/in/eric-andrews-1624b656/
☑️ Twitter/X: https://twitter.com/eric__andrews
🌟 Instagram: https://www.instagram.com/ericandrews_startups/
🔥 Discord: https://bit.ly/discord_eric
💻 Newsletter: https://bit.ly/joinericnewsletter
🎥 Clips: https://www.youtube.com/channel/UCbM6zM3al9jZSyoRyJWQL-Q
Related Excel Videos:
► Build an Excel Combo Chart (Dual Axis): https://youtu.be/g9ZdwveQydY
____________________________________________
Here is tutorial on how to create a chart in Excel.
In this tutorial, we discuss tips for chart formatting as well as thinking about the underlying data before we create the chart. You want to make sure that you use a chart that fits the story of the data.
For example, pie charts are notoriously famous for misrepresenting data. It is very difficult to tell the different between 15% and 25% and 35% of a pie chart. However, this exact type of the is displayed very clearly on a bar chart, where the bars are all stacked next to each other and can be visually compared. This is why it's important to thing about the story we want to tell and then choose the most appropriate chart to visualize the data.
There are many ways to create a chart in Excel, this video will familiarize you with some of the options we have for different styles, colors, formats, and the strategy behind creating charts.
I hope this is valuable for you!
If you'd like to learn more, I built a business-focused Excel course on Udemy that is stripped down to the core functions for being an analyst. The objective is to get people to the power-user level quickly. Take a look (link above).
► Subscribe for more finance videos: https://bit.ly/EricAndrewsSubscribe
Видео How to Create a Bar Chart in Excel | Graphs & Charts 101 канала Eric Andrews
Показать
Комментарии отсутствуют
Информация о видео
Другие видео канала
 How to Calculate CAC Payback Period for Subscription Businesses
 7 Most Important SaaS Metrics | Finance for SaaS Startups
 Understanding Free Cash Flow for Startups | Finance Case Study
 The Ultimate SaaS Unit Economics Tutorial
 Learn How to Create Drop-Down Lists in Excel: Data Validation!
 Text to Columns Excel: How to Split Data
 The Ultimate Guide to Managing Your Startup in a Recession: 7 Actions to Take
 Unit Economics Benchmarks for Two-Sided Marketplaces | From Idea to Exit
 Pivot Your Agency to a SaaS or VC Fund #finance #saas #startups
 How to Freeze Panes in Excel
 My 15K Subscriber $900 Giveaway (CLOSED) | Let's Celebrate!!
 Welcome to the Course: Become an Excel Power User in 2.5 Hours
 How to Calculate Churn Rate | Subscriptions 101
 Monthly recurring revenue 📈 explained #saas
 Seed Fundraising Guide for Startups | How to Present the Most Important Metrics
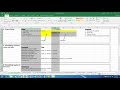 Formatting & Moving Columns, Rows & Tabs - Excel
 How to Calculate Net Dollar Retention | Finance for SaaS
 How to Show Upside, Base Case, and Downside Scenarios in Financial Model for Investors
 How to Calculate CAC for Two-Sided Marketplaces
 How to Calculate eCommerce Contribution Margins