Target Chart 2 - for Unique Targets
Learn to make a target v/s actual chart for unique targets for all values. Find all the resources and downloadable files at this link http://www.goodly.co.in/target-charts-in-excel/
- - - - My Courses - - - -
Master Excel Step by Step - https://goodly.podia.com/master-excel-step-by-step
Business Intelligence Dashboard - https://goodly.podia.com/business-intelligence-dashboards
- - - - Blog - - - -
https://www.goodly.co.in/blog
Видео Target Chart 2 - for Unique Targets канала Goodly
Показать
Комментарии отсутствуют
Информация о видео
Другие видео канала
 Dynamic Variance Arrows Chart with Check Boxes
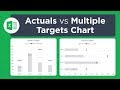 Actual vs Targets Chart in Excel
 Excel Actual v Target Charts
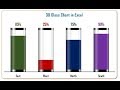 Info-graphics: 3D Glass Chart in Excel
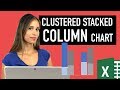 Excel Column Chart - Stacked and Clustered combination graph
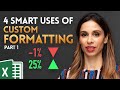 4 SMART Ways to use Custom Formatting instead of Conditional Formatting in Excel - Part 1
 Make a Dashboard in 15 Mins
 Weekly Sales chart in Excel
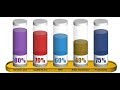 A Stunning Chart to display 5 KPI Metrics together
 Target Chart 1 - Same target for all values
 Dynamic Chart: Target Vs Actual Sales
 Better Excel Variance Charts to show percentage change (Simple & uncommon technique)
 Column Chart That Displays Percentage Change in Excel - Part 1
 How to Prepare an Overlapping Bar chart in Excel
 Actual vs Target Chart in Excel (4 Types)
 Infographics: Progress Circle Chart in Excel
 Excel Dashboard - Plan vs Actual Variances - FREE Download
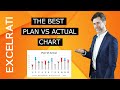 Plan VS Actual chart in Excel | The BEST One!
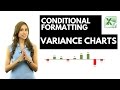 Excel Variance Charts: Actual to Previous Year or Budget Comparisons