Dynamic Variance Arrows Chart with Check Boxes
#DynamicChart #FormControls
Hello Friends, In this video, you will learn how to create a Dynamic Chart with Variance Arrows using multiple checkboxes. This is quite useful chart to display the Sale variance in compare of previous year. We have used green and red arrow to display the percentage change. This is a dynamic chart. if you will check any market name check box, data will be changed automatically on the chart.
Click here to download the practice file:
https://www.pk-anexcelexpert.com/dynamic-variance-arrows-chart-with-check-boxes/
Download our free Excel utility Tool and improve your productivity:
https://www.pk-anexcelexpert.com/products/pks-utility-tool-v1-0/
See our Excel Products:
https://www.pk-anexcelexpert.com/products/
Visit to learn more:
Chart and Visualizations: https://www.pk-anexcelexpert.com/category/blogs/charts-and-visualization/
VBA Course: https://www.pk-anexcelexpert.com/vba/
Download useful Templates: https://www.pk-anexcelexpert.com/category/templates/
Dashboards: https://www.pk-anexcelexpert.com/excel-dashboard/
Watch the best info-graphics and dynamic charts from below link:
https://www.youtube.com/playlist?list=PLbDvAYjpWJ7CEAHn-iuGSeLbUtFnYekHr
Learn and free download best excel Dashboard template:
https://www.youtube.com/playlist?list=PLbDvAYjpWJ7CpupRYMRkXSN0L92t7nUuF
Learn Step by Step VBA:
https://www.youtube.com/playlist?list=PLbDvAYjpWJ7BcoaFQD-syOrZzNSLZycwH
Website:
https://www.PK-AnExcelExpert.com
Facebook:
https://www.facebook.com/PKAnExcelExpert
Telegram:
https://t.me/joinchat/AAAAAE2OnviiEk5o1o8i4w
Twitter:
https://twitter.com/priyendra_kumar
Pinterest:
https://www.pinterest.com/PKAnExcelExpert/
Send me your queries on telegram:
@PKanExcelExpert
************* Suggested Books *********
VBA: https://amzn.to/2TMMikX
Excel Dashboard: https://amzn.to/2WZi2Fj
Power Query: https://amzn.to/2Ibd7xR
Power Pivot and Power BI: https://amzn.to/2DCg8BB
Exam Ref 70-778 (Power BI): https://amzn.to/2GnWYTN
************* My Stuff ****************
Mic : https://amzn.to/2TLnF88
Video Editor: https://screencast-o-matic.com/refer/cFe0Q6jzoA
Видео Dynamic Variance Arrows Chart with Check Boxes канала PK: An Excel Expert
Показать
Комментарии отсутствуют
Информация о видео
Другие видео канала
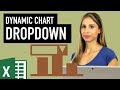 Excel Dynamic Chart with Drop down List (column graph with average line)
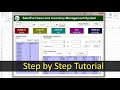 Inventory Management form in Excel | Step by step complete tutorial
 Weekly Sales chart in Excel
 Excel Dashboard - Plan vs Actual Variances - FREE Download
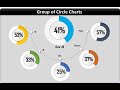 Info-graphics: Group of Circle Charts in Excel
 🧙♂️ Pivot Table Excel Tips & Tricks
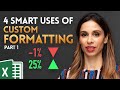 4 SMART Ways to use Custom Formatting instead of Conditional Formatting in Excel - Part 1
 Part-2: Dynamic Variance Arrows Chart with Slicers
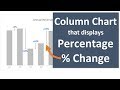 Column Chart That Displays Percentage Change in Excel - Part 1
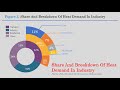 Doughnut Pie Chart in Excel - Infographic
 This Excel Chart will grab your attention (Infographic template included)
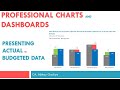 Budgeted, Actual and variance data all in one chart - part 2 vertical
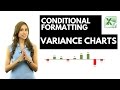 Excel Variance Charts: Actual to Previous Year or Budget Comparisons
 Info-graphics: 3D Glass Chart in Excel
 Excel Magic Trick # 267: Percentage Change Formula & Chart
 Planned vs Actual chart in Excel | With Corrective Path
 Actual vs Targets Chart in Excel
 How To Create A Modern & Dynamic Dashboard In Excel | FREE Download
 A Stunning Chart to display 5 KPI Metrics together
 Clustered Stacked Bar Chart In Excel