A Stunning Chart to display 5 KPI Metrics together
Hello Friends,
In this video you will learn how to create a stunning chart to displayed 5 KPI Metrics in a single chart. This is a space saving charts and can be used for business presentation or dashboard.
Please download this excel file from below given link:
https://www.pk-anexcelexpert.com/a-stunning-chart-to-display-the-5-kpi-metrics-together/
Watch the best info-graphics and dynamic charts from below link:
https://www.youtube.com/playlist?list=PLbDvAYjpWJ7CEAHn-iuGSeLbUtFnYekHr
Learn and free download best excel Dashboard template:
https://www.youtube.com/playlist?list=PLbDvAYjpWJ7CpupRYMRkXSN0L92t7nUuF
Learn Step by Step VBA:
https://www.youtube.com/playlist?list=PLbDvAYjpWJ7BcoaFQD-syOrZzNSLZycwH
Website:
https://www.PK-AnExcelExpert.com
Facebook:
https://facebook.com/PKAn-Excel-Expert-974812222655234/
Pinterest:
https://www.pinterest.com/PKAnExcelExpert
Telegram:
https://t.me/joinchat/AAAAAE2OnviiEk5o1o8i4w
Twitter:
https://twitter.com/priyendra_kumar
Send me your queries on telegram:
@PKanExcelExpert
************* Suggested Books *********
VBA: https://amzn.to/2TMMikX
Excel Dashboard: https://amzn.to/2WZi2Fj
Power Query: https://amzn.to/2Ibd7xR
Power Pivot and Power BI: https://amzn.to/2DCg8BB
Exam Ref 70-778 (Power BI): https://amzn.to/2GnWYTN
************* My Stuff ****************
Mic : https://amzn.to/2TLnF88
Video Editor: https://screencast-o-matic.com/refer/cFe0Q6jzoA
Видео A Stunning Chart to display 5 KPI Metrics together канала PK: An Excel Expert
Показать
Комментарии отсутствуют
Информация о видео
Другие видео канала
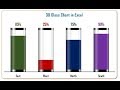 Info-graphics: 3D Glass Chart in Excel
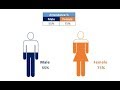 Male and Female Info-graphics in Excel
 Beautiful 3D Visualization in Excel
 8.PowerPoint Animations | Realistic GLASS FILL ANIMATION | Morph Transition 🔥🔥
 Pivot Table with Progress Chart and Dashboard
 Ultimate Speedometer in Excel: Part 1
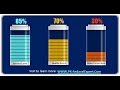 Stunning Battery Chart in Excel
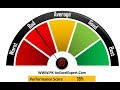 Rating Meter Chart in Excel || Five Performance Buckets || Show Process or Portfolio Health
 3D Doughnut Chart for KPI Metrics
 Weekly Sales chart in Excel
 3D Infographic Cylinder Chart in Excel 2016
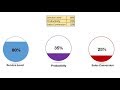 Infographics: Filling Circle Chart in Excel
 3D Container Pivot Chart with Slicers and Timeline
 How to create a battery chart in excel
 Spotlight Visualization in Excel (Part-1) | Dynamic RAG (Red, Amber, and Green) Stoplights
 Dynamic Sales Score Meter Chart with Form Control Combo box and List box
 Conditional Formatting in Multiple batteries Graph in Excel
 KPI DASHBOARD in Excel-Part 1 | How to create a KPI Dashboard in Excel | Step by Step | in Hindi
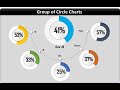 Info-graphics: Group of Circle Charts in Excel