Pivot Table with Progress Chart and Dashboard
In this Training Video I'll show you how to create a Pivot Table in Excel with dynamic Progress Doughnut Chart and a Dashboard.
Impressive result with an easy to use step by step guiding.
you can download the start file and follow along by clicking on the link
https://www.amazon.ca/clouddrive/share/8nZ7zkfT6gxM6p9vuQofUxCmQkEh1gopblLwwUnfFpK
******* COMPLETE COURSE *******
Watch my latest Tutorial, which is a Complete Course on Dashboard Creation using Form Controls:
https://www.youtube.com/watch?v=BVAEsemQM30
Watch How to create a searchable drop list in Excel Just like Google
https://www.youtube.com/edit?o=U&video_id=8gqodEiDoJ8
Видео Pivot Table with Progress Chart and Dashboard канала Officeinstructor
Показать
Комментарии отсутствуют
Информация о видео
Другие видео канала
 Create an Interactive Excel Dashboard In Under 3 MINUTES!
 Microsoft Excel Tutorial for Beginners - Full Course
 How to build Interactive Excel Dashboards
 Make Animated PowerPoint Slide
 Rating Meter Chart in Excel || Five Performance Buckets || Show Process or Portfolio Health
 Vlookup simply explained
 Advanced Pivot Table Techniques (to achieve more in Excel)
 Progress Circle Chart in Excel - Part 1 of 2
 4 SMART Ways to use Custom Formatting instead of Conditional Formatting in Excel - Part 1
 Info-graphics: Group of Circle Charts in Excel
 Progress Circle Chart in Excel as NEVER seen before!
 TECH-014 - Create a progress tracker with check boxes in Excel
 Fully Automated Excel dashboard with multiple source files | No VBA used
 Learn Pivot Tables in 6 Minutes (Microsoft Excel)
 Excel Pivot Tables EXPLAINED in 10 Minutes (Productivity tips included!)
 How to Create Impressive Interactive Excel Dashboard | Ultimate Excel Dashboard Ep. 1
 Interactive Excel HR Dashboard - FREE Download
 This Excel Chart will grab your attention (Infographic template included)
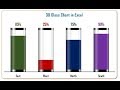 Info-graphics: 3D Glass Chart in Excel