Dynamic Sales Score Meter Chart with Form Control Combo box and List box
#Speedometer #FormControls
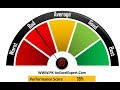
In this video, you will learn how to create a dynamic sales score meter chart. In this chart we have displayed the sales core on a speedometer chart. We have displayed the sales rating also as Worst, Bad, Average, Good and Best. We have created 2 different version of this chart. We have used Form control combo box and list box to make it dynamic.
Please download the practice file from below given link:
https://www.pk-anexcelexpert.com/dynamic-sales-score-meter-chart/
Download our free Excel utility Tool and improve your productivity:
https://www.pk-anexcelexpert.com/products/pks-utility-tool-v1-0/
See our Excel Products:
https://www.pk-anexcelexpert.com/products/
Visit to learn more:
Chart and Visualizations: https://www.pk-anexcelexpert.com/category/blogs/charts-and-visualization/
VBA Course: https://www.pk-anexcelexpert.com/vba/
Download useful Templates: https://www.pk-anexcelexpert.com/category/templates/
Dashboards: https://www.pk-anexcelexpert.com/excel-dashboard/
Watch the best info-graphics and dynamic charts from below link:
https://www.youtube.com/playlist?list=PLbDvAYjpWJ7CEAHn-iuGSeLbUtFnYekHr
Learn and free download best excel Dashboard template:
https://www.youtube.com/playlist?list=PLbDvAYjpWJ7CpupRYMRkXSN0L92t7nUuF
Learn Step by Step VBA:
https://www.youtube.com/playlist?list=PLbDvAYjpWJ7BcoaFQD-syOrZzNSLZycwH
Website:
https://WWW.PK-AnExcelExpert.com
Facebook:
https://www.facebook.com/PKAnExcelExpert
Telegram:
https://t.me/joinchat/AAAAAE2OnviiEk5o1o8i4w
Pinterest:
https://www.pinterest.com/PKAnExcelExpert/
************* Suggested Books *********
VBA: https://amzn.to/2TMMikX
Excel Dashboard: https://amzn.to/2WZi2Fj
Power Query: https://amzn.to/2Ibd7xR
Power Pivot and Power BI: https://amzn.to/2DCg8BB
Exam Ref 70-778 (Power BI): https://amzn.to/2GnWYTN
************* My Stuff ****************
Mic : https://amzn.to/2TLnF88
Video Editor: https://screencast-o-matic.com/refer/cFe0Q6jzoA
Видео Dynamic Sales Score Meter Chart with Form Control Combo box and List box канала PK: An Excel Expert
Показать
Комментарии отсутствуют
Информация о видео
Другие видео канала
 Rating Meter Chart in Excel || Five Performance Buckets || Show Process or Portfolio Health
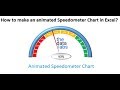 How to make an animated Speedometer Chart in Excel?
 Speedometer Chart in Excel 2019
 Fully Automated Excel dashboard with multiple source files | No VBA used
 Multicolor Filling Bars in Excel Cells Without using Chart
 Build a Score Meter Chart in Excel - Infographic Chart Tutorial
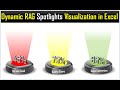 Spotlight Visualization in Excel (Part-1) | Dynamic RAG (Red, Amber, and Green) Stoplights
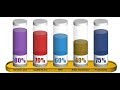 A Stunning Chart to display 5 KPI Metrics together
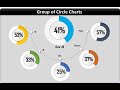 Info-graphics: Group of Circle Charts in Excel
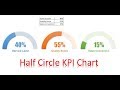 Half Circle KPI info graphic chart
 Innovation: Focus Chart in Excel
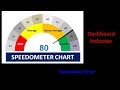 Create ‘Speedometer Chart’ in Excel Sheet (English)
 Info-graphics: Stylish Traffic Lights in Excel
 Dynamic Chart with Drop-down - Advanced Excel
 OFFSET function to change Source Data for a Dynamic Chart
 Informative KPI Indicator Chart (Version-1)
 Power Point Visualization: Animated Target Vs Actual Sales Chart
 RYG Dial Gauge meter In Excel (Without Macros)
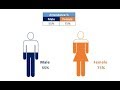 Male and Female Info-graphics in Excel
 How to Create STUNNING Speedometer Chart Template in PowerPoint