Infographics: Filling Circle Chart in Excel
Hello Friends,
In this video you will learn how to create a KPI Info-graphics (a filling circle chart) in Excel without using of any macro.
Please download this excel file from below given link:
https://www.pk-anexcelexpert.com/filling-circle-chart/
Watch the best info-graphics and dynamic charts from below link:
https://www.youtube.com/playlist?list=PLbDvAYjpWJ7CEAHn-iuGSeLbUtFnYekHr
Facebook:
https://facebook.com/PKAn-Excel-Expert-974812222655234/
Telegram:
https://t.me/joinchat/AAAAAE2OnviiEk5o1o8i4w
blogger:
http://pk-anexcelexpert.blogspot.in/
Twitter:
https://twitter.com/priyendra_kumar
Send me your queries on telegram:
@PKanExcelExpert
Видео Infographics: Filling Circle Chart in Excel канала PK: An Excel Expert
Показать
Комментарии отсутствуют
Информация о видео
Другие видео канала
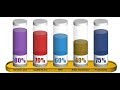 A Stunning Chart to display 5 KPI Metrics together
 Progress Circle Chart in Excel as NEVER seen before!
 Info-graphics Chart Series: Video - 2
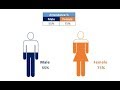 Male and Female Info-graphics in Excel
 Infographics: KPI Indicators with excel cells
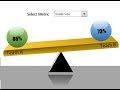 Infographics: Comparison between two teams in Excel
 Pivot Table with Progress Chart and Dashboard
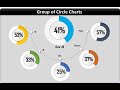 Info-graphics: Group of Circle Charts in Excel
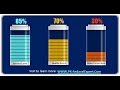 Stunning Battery Chart in Excel
 How to create a battery chart in excel
 Balloon Chart in Excel
 This Excel Chart will grab your attention (Infographic template included)
 RYG Dial Gauge meter In Excel (Without Macros)
 Weekly Sales chart in Excel
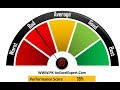 Rating Meter Chart in Excel || Five Performance Buckets || Show Process or Portfolio Health
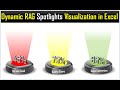 Spotlight Visualization in Excel (Part-1) | Dynamic RAG (Red, Amber, and Green) Stoplights
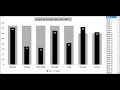 Dynamic Chart: Target Vs Actual Sales
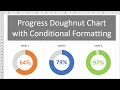 Progress Circle Chart with Conditional Formatting - Part 2 of 2
 Doughnut Pie Chart in Excel - Infographic