Actual vs Targets Chart in Excel
In this post, I explain how to create an Actual vs Targets chart in Excel. This chart overlays the projected or goal numbers with the actual performance numbers realized for a time period.
The chart can be used to compare multiple targets, goals, budget amounts, forecast projections, etc. It can also be created as either a bar or column chart.
If you’d like to see the accompanying blog post on my website, you can find it at this link: https://www.excelcampus.com/charts/actual-vs-target-chart/
Additional Resources:
Column Chart That Displays Percentage Change in Excel - Part 1: https://www.youtube.com/watch?v=SRTwzaTRfCc
Percentage Change in Excel Charts with Color Bars - Part 2: https://www.youtube.com/watch?v=zaYfih4aOGE
Column Chart That Displays Percentage Change - Part 3: https://www.youtube.com/watch?v=X0ySDc5KwsM
#MsExcel #ExcelCampus
Видео Actual vs Targets Chart in Excel канала Excel Campus - Jon
Показать
Комментарии отсутствуют
Информация о видео
Другие видео канала
 Excel Dashboard - Plan vs Actual Variances - FREE Download
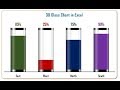 Info-graphics: 3D Glass Chart in Excel
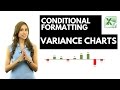 Excel Variance Charts: Actual to Previous Year or Budget Comparisons
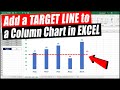 How to Add a Target Line to a Column Chart (2 Methods)
 Pivot Table with Progress Chart and Dashboard
 Excel Actual v Target Charts
 Infographics: Progress Circle Chart in Excel
 Target Chart 2 - for Unique Targets
 7 Uncommon Excel Shortcuts to Teach to Your Coworkers
 Planned vs Actual chart in Excel | With Corrective Path
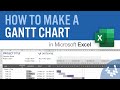 How to Make a Gantt Chart in Excel
 This Excel Chart will grab your attention (Infographic template included)
 How to easily automate boring Excel tasks with Power Query!
 Progress Circle Chart in Excel as NEVER seen before!
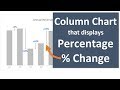 Column Chart That Displays Percentage Change in Excel - Part 1
 Secrets to Building Excel Dashboards in Under 15 Minutes!
 Create a Pivot Table from Multiple Sheets in Excel | Comprehensive Tutorial!
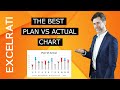 Plan VS Actual chart in Excel | The BEST One!
 Doughnut Pie Chart in Excel - Infographic