Excel Variance Charts: Actual to Previous Year or Budget Comparisons
In this video I show you how you can use conditional formatting in Excel Column or Excel Bar charts.
Complete Advanced Excel Chart Course: https://courses.xelplus.com/p/excel-charts-visualization-secrets-for-impressive-charts
I also show you how you can conditionally format the data labels in Excel graphs to show a different color if the values are positive to when the values are negative.
The technique in the video shows a variance column chart but it works in the same way for a bar chart.
This technique works for Excel 2010, Excel 2013 and Excel 2016. For Excel 2007 and below, you need to use a different technique. You will need to create two additional series, one for positive number and another for negative numbers and format each series accordingly - and also overlap these by 100%.
Part 2 - Better Variance charts https://youtu.be/73s3qej4vi0
Part 3 - Arrow Variance Chart https://youtu.be/-wYJdbb8-0Y
Custom formatting is covered in more detail in my online Excel advanced course here: http://www.xelplus.com/onlineAdvancedExcelCourse
★ My Online Excel Courses ► https://courses.xelplus.com/
✉ Subscribe & get my TOP 10 Excel formulas e-book for free
https://www.xelplus.com/free-ebook/
EXCEL RESOURCES I Recommend: https://www.xelplus.com/resources/
Get Office 365: https://microsoft.msafflnk.net/15OEg
Microsoft Surface: https://microsoft.msafflnk.net/c/1327040/451518/7593
GEAR
Screen recorder: http://techsmith.pxf.io/c/1252781/347799/5161
Main Camera: https://amzn.to/3a5ldBs
Backup Camera: https://amzn.to/2FLiFho
Main Lens: https://amzn.to/39apgeD
Zoom Lens: https://amzn.to/3bd5pN7
Audio Recorder: https://amzn.to/2Uo5rLm
Microphone: https://amzn.to/2xYy9em
Lights: http://amzn.to/2eJKg1U
More resources on my Amazon page: https://www.amazon.com/shop/leilagharani
Note: This description contains affiliate links, which means at no additional cost to you, we will receive a small commission if you make a purchase using the links. This helps support the channel and allows us to continue to make videos like this. Thank you for your support!
#MsExcel
Видео Excel Variance Charts: Actual to Previous Year or Budget Comparisons канала Leila Gharani
Показать
Комментарии отсутствуют
Информация о видео
Другие видео канала
 Better Excel Variance Charts to show percentage change (Simple & uncommon technique)
 Excel Dashboard - Plan vs Actual Variances - FREE Download
 TOO MANY EMAILS? Use THESE Proven Techniques | Outlook tips included
 6 FREE Add-Ins for Excel to Start Using Now
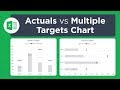 Actual vs Targets Chart in Excel
 Dynamic Variance Arrows Chart with Check Boxes
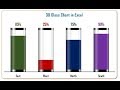 Info-graphics: 3D Glass Chart in Excel
 Variance Analysis (Budget vs. Actuals) Excel Template Step-by-Step Video Tutorial by Simple Sheets
 Excel Advanced Charts: Comparison to Budget, Previous Year and Forecast or Outlook
 Master Excel's SUMPRODUCT Formula
 4 SMART Ways to use Custom Formatting instead of Conditional Formatting in Excel - Part 1
 Excel RANK without Skipping Numbers (Top 3 Report with Duplicates)
 4 Hidden Excel Dashboard Design Tips for Beautiful Reports
 How to Use Microsoft Teams Effectively | Your COMPLETE Guide
 Secrets to Building Excel Dashboards in Under 15 Minutes!
 Simple Excel Trick to Conditionally Format Your Bar Charts
 Excel Pivot Tables EXPLAINED in 10 Minutes (Productivity tips included!)
 Optimized Excel Line Charts: Prevent drop to zero & dynamic Legend positioning
 This Excel Chart will grab your attention (Infographic template included)
 Animate Charts Properly in PowerPoint