Excel Column Chart - Stacked and Clustered combination graph
Easy steps to create a clustered stacked column chart in Excel - this chart is both stacked and clustered. This type of chart is not available in the standard Excel chart selection. With a few steps, you'll learn how to create this from scratch.
One way of creating a clustered and stacked column chart combination is to use both the primary and secondary Y-axis. One problem you'll run into is that they will likely have a different minimum and maximum which will show the wrong visualization. You need to ensure that both the primary and secondary y-axis have the same minimum and maximum in a dynamic way (without manually fixing these values). I show you the trick on how you can set this up.
🡻 Download the workbook here
http://www.xelplus.com/excel-clustered-column-and-stacked-chart/
Links to related videos:
Charts Basics: https://youtu.be/DAU0qqh_I-A
Dynamic Charts based on drop-down selection: https://youtu.be/22jcw5slQJk
★ My Online Excel Courses ► https://courses.xelplus.com/
✉ Subscribe & get my TOP 10 Excel formulas e-book for free
https://www.xelplus.com/free-ebook/
EXCEL RESOURCES I Recommend: https://www.xelplus.com/resources/
Get Office 365: https://microsoft.msafflnk.net/15OEg
Microsoft Surface: https://microsoft.msafflnk.net/c/1327040/451518/7593
GEAR
Screen recorder: http://techsmith.pxf.io/c/1252781/347799/5161
Main Camera: https://amzn.to/3a5ldBs
Backup Camera: https://amzn.to/2FLiFho
Main Lens: https://amzn.to/39apgeD
Zoom Lens: https://amzn.to/3bd5pN7
Audio Recorder: https://amzn.to/2Uo5rLm
Microphone: https://amzn.to/2xYy9em
Lights: http://amzn.to/2eJKg1U
More resources on my Amazon page: https://www.amazon.com/shop/leilagharani
Note: This description contains affiliate links, which means at no additional cost to you, we will receive a small commission if you make a purchase using the links. This helps support the channel and allows us to continue to make videos like this. Thank you for your support!
#MsExcel
Видео Excel Column Chart - Stacked and Clustered combination graph канала Leila Gharani
Показать
Комментарии отсутствуют
Информация о видео
Другие видео канала
 3 REALLY Useful Excel Chart Tips You May Have Missed
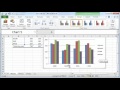 Clustered columns chart in Excel
 Clustered Stacked Bar Chart In Excel
 Stacked & Clustered - 1091 - Learn Excel Podcast
 Excel Pivot Tables EXPLAINED in 10 Minutes (Productivity tips included!)
 4 SMART Ways to use Custom Formatting instead of Conditional Formatting in Excel - Part 1
 Excel Charts: Matrix or Excel Panel Charts - Showing many variables at once
 Progress Circle Chart in Excel as NEVER seen before!
 Excel Charts & Graphs: Learn the Basics for a Quick Start
 Excel Charts: Total Values for Stacked Charts in Excel
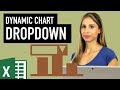 Excel Dynamic Chart with Drop down List (column graph with average line)
 Weekly Sales chart in Excel
 Create a Combination Chart with a Totals Label
 How To Create A Clustered Stacked Column Chart In Excel
 Doughnut Pie Chart in Excel - Infographic
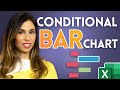 Simple Excel Trick to Conditionally Format Your Bar Charts
 Target Chart 2 - for Unique Targets
 Advanced Pivot Table Techniques (to achieve more in Excel)
 Excel Variance Charts: Actual to Previous Year or Budget Comparisons
 Trick Excel into Creating Regular Charts from PivotTables - 3 Easy Techniques