Excel Charts & Graphs: Learn the Basics for a Quick Start
Learn the basics of Excel charts to be able to quickly create graphs for your Excel reports.
Written instructions: http://www.xelplus.com/charts-basics/
In this video you'll learn:
1. How to insert an Excel Chart
2. How to adjust a chart (edit the chart)
3. How to improve a chart
4. How to add series to a chart
5. How to create combination charts (charts that show more than one variable - or multiple data sets) - for example how to combine a column chart with a line chart.
The type of Excel charts covered are column, bar, line and a combination of column and line chart. Use these charts to make comparisons or show trends.
Links to related videos:
Chart Playlist on YouTube ► https://www.youtube.com/playlist?list=PLmHVyfmcRKyyEj7oQkCf7TL9yQQWXbGOQ
Using shapes in charts (non-standard graphs): https://youtu.be/C9beIaL-cBA
★ My Online Excel Courses ► https://www.xelplus.com/courses/
✉ Subscribe & get my TOP 10 Excel formulas e-book for free
https://www.xelplus.com/free-ebook/
EXCEL RESOURCES I Recommend: https://www.xelplus.com/resources/
Get Office 365: https://microsoft.msafflnk.net/15OEg
Microsoft Surface: https://microsoft.msafflnk.net/c/1327040/451518/7593
GEAR
Camera: https://amzn.to/2FLiFho
Screen recorder: http://techsmith.pxf.io/c/1252781/347799/5161
Microphone: https://amzn.to/2DVKstA
Lights: http://amzn.to/2eJKg1U
More resources on my Amazon page: https://www.amazon.com/shop/leilagharani
Let’s connect on social:
Instagram: https://www.instagram.com/lgharani
Twitter: https://twitter.com/leilagharani
LinkedIn: https://at.linkedin.com/in/leilagharani
Note: This description contains affiliate links, which means at no additional cost to you, we will receive a small commission if you make a purchase using the links. This helps support the channel and allows us to continue to make videos like this. Thank you for your support!
#MsExcel
Видео Excel Charts & Graphs: Learn the Basics for a Quick Start канала Leila Gharani
Показать
Комментарии отсутствуют
Информация о видео
Другие видео канала
 This Excel Chart will grab your attention (Infographic template included)
 Which is the best chart: Selecting among 14 types of charts Part I
 Excel shortcut keys you SHOULD know!
 Secrets to Building Excel Dashboards in Under 15 Minutes!
 How to Make a Line Graph in Excel - From Simple to Scientific
 Excel Pivot Tables EXPLAINED in 10 Minutes (Productivity tips included!)
 Introduction to Pivot Tables, Charts, and Dashboards in Excel (Part 1)
 Excel Quick and Simple Charts Tutorial
 Build Impressive Charts: It's NOT your usual Bar Chart (Infographics in Excel)
 Basic Excel Formulas and Functions You NEED to KNOW!
 Excel Variance Charts: Actual to Previous Year or Budget Comparisons
 The Beginner's Guide to Excel - Excel Basics Tutorial
 MS Excel - Pie, Bar, Column & Line Chart
 4 SMART Ways to use Custom Formatting instead of Conditional Formatting in Excel - Part 1
 Animate Charts Properly in PowerPoint
 3 REALLY Useful Excel Chart Tips You May Have Missed
 Excel Formulas and Functions Tutorial
 Excel for Accounting - 10 Excel Functions You NEED to KNOW!
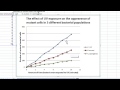 How to make a line graph in Excel (Scientific data)