Surface Nitrogen Dioxide in the Washington D.C. region.
A data visualization of surface-level nitrogen dioxide data for the Washington DC region spanning 2005-2020 (annual averages). Higher values are represented with dark purple and lower values are represented with light blue.
Surface-level nitrogen dioxide data from the Goddard Earth Sciences Data and Information Services Center (GES DISC)
For additional details visit the SVS page: https://svs.gsfc.nasa.gov/5104
Видео Surface Nitrogen Dioxide in the Washington D.C. region. канала NASA Scientific Visualization Studio
Surface-level nitrogen dioxide data from the Goddard Earth Sciences Data and Information Services Center (GES DISC)
For additional details visit the SVS page: https://svs.gsfc.nasa.gov/5104
Видео Surface Nitrogen Dioxide in the Washington D.C. region. канала NASA Scientific Visualization Studio
Показать
Комментарии отсутствуют
Информация о видео
8 июня 2023 г. 5:57:28
00:00:16
Другие видео канала
 Earth Information Center
 Map Projections Morph
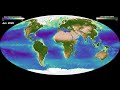 Global Biosphere March 2017 - Feb 2022
 Earth: A System of Systems
 Spread of the Dixie Fire
 GEDI Forest Height
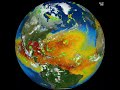 2022 Hurricane Season
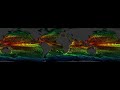 Ocean Flows
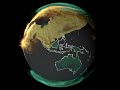 Atmospheric Carbon Dioxide Tagged by Source: Australia and Asia
 Atmospheric Carbon Dioxide Tagged by Source: The Americas
 Atmospheric Carbon Dioxide Tagged by Source: Europe, the Middle East, and Africa.
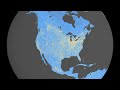 Surface Nitrogen Dioxide across North America
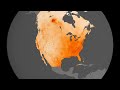 Particulate Matter 2.5 (PM2.5) across North America
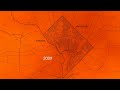 PM2.5 in the Washington D.C. region
 Nitrogen Dioxide Over the United States, 2005-2022
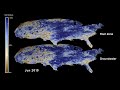 Relative Wetness Root Zone Versus Groundwater Comparison
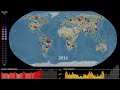 Water Cycle Extremes
 Global Carbon Dioxide 2020-2021
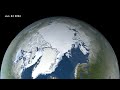 Arctic Sea Ice Minimum 2022.
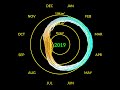 Arctic Sea Ice Spiral