Relative Wetness Root Zone Versus Groundwater Comparison
These maps combine data from the Gravity Recovery and Climate Experiment (GRACE) and GRACE Follow-On (GRACE-FO) with other satellite and ground-based measurements to model the relative amount of water stored at two different depths: plant root level and underground. The brown regions represent dry conditions. The blue regions represent wet areas. All of the maps are experimental products funded by NASA’s Applied Sciences Program and developed by scientists at NASA’s Goddard Space Flight Center and the National Drought Mitigation Center. The maps do not attempt to represent human consumption of water; but rather, they show changes in water storage related to weather, climate, and seasonal patterns.
More details are available on the SVS page: https://svs.gsfc.nasa.gov/5098
Видео Relative Wetness Root Zone Versus Groundwater Comparison канала NASA Scientific Visualization Studio
More details are available on the SVS page: https://svs.gsfc.nasa.gov/5098
Видео Relative Wetness Root Zone Versus Groundwater Comparison канала NASA Scientific Visualization Studio
Показать
Комментарии отсутствуют
Информация о видео
8 июня 2023 г. 2:12:16
00:01:31
Другие видео канала
 Some Like It Hot! by Tibor Kremic
 Alex Young: Sun and Moon Together Again: Helio Science from the Moon
 A Quarter Century US Forest Disturbance History from Landsat – the NAFD-NEX Products
 Earth Day 2020: Sea Surface Temperature (SST) from January 2016 through March 2020
 Curating NASA's Extraterrestrial Samples from Past and Future Sample Return Missions
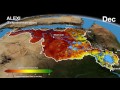 The Distributed Water Balance of the Nile Basin
 Sunny with a Chance of Space Storms by Alex Young
 Greenland's Jakobshavn Region: Simulated Ice Sheet Response Scenario RCP 8.5: 2008 - 2300
 Paula Bontempi: An Overview of Earth Science at NASA
 AGU 2023 Tuesday Introductory Remarks from AGU & NASA
 Anna Barth: Listening to Eruption Dynamics at Lone Star Gyser, Using Multivariate Sonification
 Arctic Sea Ice Minimum 2022.
 From Slime to Solutions: Monitoring water quality and cyanobacteria from space
 Explore the Literature in the New ADS
 Future of infectious diseases: How Earth observations can help predict next pandemics?
 IceFlow: Harmonizing NASA ICESat, IceBridge, and ICESat-2 data
 EXPORTS
 Jakobshavn Regional View of Simulated Greenland Ice Sheet Response Scenario - RCP 2.6: 2008 - 2300
 Warning! Local Tsunami Alert from GPS Array by Dara Goldberg
 Antarctic Bedrock
 The Connected Solar System SSTP