Arctic Sea Ice Minimum 2022.
Satellite-based passive microwave images of the sea ice have provided a reliable tool for continuously monitoring changes in the Arctic ice since 1979. Every summer the Arctic ice cap melts down to what scientists call its "minimum" before colder weather begins to cause ice cover to increase. An analysis of satellite data by NASA and the National Snow and Ice Data Center (NSIDC) at the University of Colorado Boulder shows that the 2021 minimum extent, which was likely reached on Sept. 18, measured 1.80 million square miles (4.67 million square kilometers).
The Japan Aerospace Exploration Agency (JAXA) provides many water-related products derived from data acquired by the Advanced Microwave Scanning Radiometer 2 (AMSR2) instrument aboard the Global Change Observation Mission 1st-Water "SHIZUKU" (GCOM-W1) satellite. Two JAXA datasets used in this animation are the 10-km daily sea ice concentration and the 10 km daily 89 GHz Brightness Temperature.
In this animation, the daily Arctic sea ice and seasonal land cover change progress through time, from the yearly maximum ice extent on February 25 2022, through its minimum on September 18 2022. Over the water, Arctic sea ice changes from day to day showing a running 3-day minimum sea ice concentration in the region where the concentration is greater than 15%. The blueish white color of the sea ice is derived from a 3-day running minimum of the AMSR2 89 GHz brightness temperature. The yellow boundary shows the minimum extent averaged over the 30-year period from 1981 to 2010. Over the terrain, monthly data from the seasonal Blue Marble Next Generation fades slowly from month to month.For more details visit the SVS page: https://svs.gsfc.nasa.gov/5030
Видео Arctic Sea Ice Minimum 2022. канала NASA Scientific Visualization Studio
Показать
Комментарии отсутствуют
Информация о видео
8 июня 2023 г. 0:25:17
00:00:54
Другие видео канала
 Some Like It Hot! by Tibor Kremic
 Alex Young: Sun and Moon Together Again: Helio Science from the Moon
 A Quarter Century US Forest Disturbance History from Landsat – the NAFD-NEX Products
 Earth Day 2020: Sea Surface Temperature (SST) from January 2016 through March 2020
 Curating NASA's Extraterrestrial Samples from Past and Future Sample Return Missions
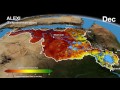 The Distributed Water Balance of the Nile Basin
 Sunny with a Chance of Space Storms by Alex Young
 Greenland's Jakobshavn Region: Simulated Ice Sheet Response Scenario RCP 8.5: 2008 - 2300
 Paula Bontempi: An Overview of Earth Science at NASA
 AGU 2023 Tuesday Introductory Remarks from AGU & NASA
 Anna Barth: Listening to Eruption Dynamics at Lone Star Gyser, Using Multivariate Sonification
 From Slime to Solutions: Monitoring water quality and cyanobacteria from space
 Explore the Literature in the New ADS
 Future of infectious diseases: How Earth observations can help predict next pandemics?
 IceFlow: Harmonizing NASA ICESat, IceBridge, and ICESat-2 data
 EXPORTS
 Jakobshavn Regional View of Simulated Greenland Ice Sheet Response Scenario - RCP 2.6: 2008 - 2300
 Warning! Local Tsunami Alert from GPS Array by Dara Goldberg
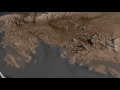 Antarctic Bedrock
 The Connected Solar System SSTP