Atmospheric Carbon Dioxide Tagged by Source: Europe, the Middle East, and Africa.
Carbon dioxide (CO2) is the most prevalent greenhouse gas driving global climate change. However, its increase in the atmosphere would be even more rapid without land and ocean carbon sinks, which collectively absorb about half of human emissions every year. Advanced computer modeling techniques in NASA's Global Modeling and Assimilation Office allow us to disentangle the influences of sources and sinks and to better understand where carbon is coming from and going to.
This visualization shows the CO2 being added to Earth's atmosphere over the course of the year 2021, split into four major contributors: fossil fuels in orange, burning biomass in red, land ecosystems in green, and the ocean in blue. The dots on the surface also show how atmospheric carbon dioxide is also being absorbed by land ecosystems in green and the ocean in blue. Though the land and oceans are each carbon sinks in a global sense, individual locations can be sources at different times.
This view highlights Europe, the Middle East, and Africa. European fossil fuel emissions are visible as red representing emissions from fires over central Africa that are used to clear crop residue. Fires represent a much smaller source of CO2 to the atmosphere than fossil fuel emissions, but are significant because they can alter the ability of an ecosystem to sequester carbon in the future. Scientists are carefully monitoring how CO2 emissions from fires are altered by climate change, which is bringing longer and more severe fire seasons to many areas.
For additional details visit the SVS page: https://svs.gsfc.nasa.gov/5110
Видео Atmospheric Carbon Dioxide Tagged by Source: Europe, the Middle East, and Africa. канала NASA Scientific Visualization Studio
Показать
Комментарии отсутствуют
Информация о видео
8 июня 2023 г. 6:15:19
00:01:38
Другие видео канала
 Earth Information Center
 Map Projections Morph
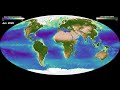 Global Biosphere March 2017 - Feb 2022
 Earth: A System of Systems
 Spread of the Dixie Fire
 GEDI Forest Height
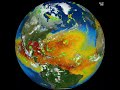 2022 Hurricane Season
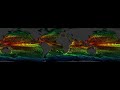 Ocean Flows
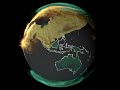 Atmospheric Carbon Dioxide Tagged by Source: Australia and Asia
 Atmospheric Carbon Dioxide Tagged by Source: The Americas
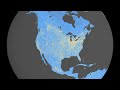 Surface Nitrogen Dioxide across North America
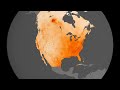 Particulate Matter 2.5 (PM2.5) across North America
 PM2.5 in the Washington D.C. region
 Surface Nitrogen Dioxide in the Washington D.C. region.
 Nitrogen Dioxide Over the United States, 2005-2022
 Relative Wetness Root Zone Versus Groundwater Comparison
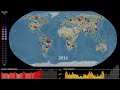 Water Cycle Extremes
 Global Carbon Dioxide 2020-2021
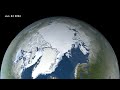 Arctic Sea Ice Minimum 2022.
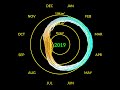 Arctic Sea Ice Spiral