Map Projections Morph
For full details visit: https://svs.gsfc.nasa.gov/5090
Map projections are a way of representing regions on the surface of a spherical object on a flat surface. For example, a continent on the Earth can be represented on a flat map. There are many map projections, but some are more prevalent in our work with scientific visualization data. Map projections are chosen based on the characteristics required by researchers. There is no perfect way to represent a spherical surface on a flat map, so no matter what map projection is chosen distortions occur. Some projections can preserve properties like: area, shape, and direction; so, projections are chosen depending on the scientist's needs.
This visualization shows some of the more common projections that SVS has encountered. Some of these projections have parameters that change the central point of the projection. In those cases, the parameters are animated and shown in the lower left.
Also included in this visualization are circles/ovals that are similar to "Tissot's Indicatrices". These are all circles of the same size on the spherical earth. Map projections distort them depending on the projection. The area of every circle is 1 million km² or about the size of Egypt. With each projection, the distortions of these circles show how shape and area are distorted in different parts of the projection.
The following projections are shown:
equirectangular
robinson
mollweide
hammer
sinusoidal
polar stereographic
lambert azimuthal
albers equal area conic
wrapped to a sphere
mercator
Видео Map Projections Morph канала NASA Scientific Visualization Studio
Показать
Комментарии отсутствуют
Информация о видео
15 июня 2023 г. 18:53:06
00:00:48
Другие видео канала
 Some Like It Hot! by Tibor Kremic
 Alex Young: Sun and Moon Together Again: Helio Science from the Moon
 A Quarter Century US Forest Disturbance History from Landsat – the NAFD-NEX Products
 Earth Day 2020: Sea Surface Temperature (SST) from January 2016 through March 2020
 Curating NASA's Extraterrestrial Samples from Past and Future Sample Return Missions
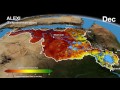 The Distributed Water Balance of the Nile Basin
 Sunny with a Chance of Space Storms by Alex Young
 Greenland's Jakobshavn Region: Simulated Ice Sheet Response Scenario RCP 8.5: 2008 - 2300
 Paula Bontempi: An Overview of Earth Science at NASA
 AGU 2023 Tuesday Introductory Remarks from AGU & NASA
 Anna Barth: Listening to Eruption Dynamics at Lone Star Gyser, Using Multivariate Sonification
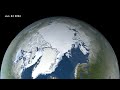 Arctic Sea Ice Minimum 2022.
 From Slime to Solutions: Monitoring water quality and cyanobacteria from space
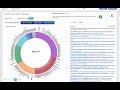 Explore the Literature in the New ADS
 Future of infectious diseases: How Earth observations can help predict next pandemics?
 IceFlow: Harmonizing NASA ICESat, IceBridge, and ICESat-2 data
 EXPORTS
 Jakobshavn Regional View of Simulated Greenland Ice Sheet Response Scenario - RCP 2.6: 2008 - 2300
 Warning! Local Tsunami Alert from GPS Array by Dara Goldberg
 Antarctic Bedrock
 The Connected Solar System SSTP