Global Carbon Dioxide 2020-2021
NASA’s Orbiting Carbon Observatory, 2 (OCO-2) provides the most complete dataset tracking the concentration of atmospheric carbon dioxide (CO2), the main driver of climate change. Every day, OCO-2 measures sunlight reflected from Earth’s surface to infer the dry-air column-averaged CO2 mixing ratio and provides around 100,000 cloud-free observations. Despite these advances, OCO-2 data contain many gaps where sunlight is not present or where clouds or aerosols are too thick to retrieve CO2 data. In order to fill gaps and provide science and applications users a spatially complete product, OCO-2 data are assimilated into NASA’s Goddard Earth Observing System (GEOS), a complex modeling and data assimilation system used for studying the Earth’s weather and climate. GEOS is also informed by satellite observations of nighttime lights and vegetation greenness along with about 1 million weather observations collected every hour. These data help scientists infer CO2 mixing ratios even when a direct OCO-2 observation is not present and provide additional information on the altitude of CO2 plumes that the satellite is not able to see. Together, OCO-2 and GEOS create one of the most complete pictures of CO2.
The visualization featured on this page shows the atmosphere in three dimensions and highlights the accumulation of CO2 during a single calendar year. Every year, the world’s vegetation and oceans absorb about half of human CO2 emissions, providing an incredibly valuable service that has mitigated the rate of accumulation of greenhouse gases in the atmosphere. However, around 2.5 parts per million remain in the atmosphere every year causing a steady upward march in concentrations that scientists have tracked since the 1950s at surface stations.
The volumetric visualization starts in June 2020, showing all of the model’s values of global CO2. All 3d cells of the model are opaque, revealing a solid brick of data. During the month of June 2020, the higher values of CO2 coalesce around the equatorial belt. By mid-July 2020 the visualization reduces the opacity of lower CO2 values between 385 parts-per-millon (ppm) and 405 ppm in the atmosphere making them transparent. These lower values tend to be higher up in the atmosphere. By doing this, the higher CO2 concentrations, which are closer to the ground, are highlighted revealing the seasonal movement of high CO2 at a global scale. During the months of June-September (summer months for northern hemisphere), global CO2 concentrations tend to be lowest because northern hemisphere plants actively absorb CO2 from the atmosphere via photosynthesis. During northern hemisphere fall and winter months, much of this CO2 is re-released to the atmosphere due to respiration and can be seen building up. By June and July 2021, plants again draw CO2 out of the atmosphere, but notably higher concentrations remain in contrast to the nearly transparent colors of the previous year. The diurnal rhythm of CO2 is apparent over our planet's largest forests, such as the Amazon rainforest in South America and the Congo rainforest in Central Africa. The fast-paced pulse in those rainforests is due to the day-night cycle; plants absorb CO2 during the day via photosynthesis when the sun is out, then stop absorbing CO2 at night. In addition to highlighting the buildup of atmospheric CO2, this visualization shows how interconnected the world’s greenhouse gas problem is. NASA’s unique combination of observations and models plays a critical role in helping scientists track increases in CO2 as they happen to better understand their climate impact.
For more details visit the SVS page: https://svs.gsfc.nasa.gov/4983
Видео Global Carbon Dioxide 2020-2021 канала NASA Scientific Visualization Studio
Показать
Комментарии отсутствуют
Информация о видео
8 июня 2023 г. 0:27:16
00:01:53
Другие видео канала
 Earth Information Center
 Map Projections Morph
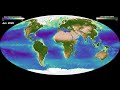 Global Biosphere March 2017 - Feb 2022
 Earth: A System of Systems
 Spread of the Dixie Fire
 GEDI Forest Height
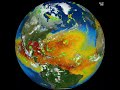 2022 Hurricane Season
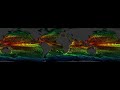 Ocean Flows
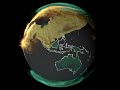 Atmospheric Carbon Dioxide Tagged by Source: Australia and Asia
 Atmospheric Carbon Dioxide Tagged by Source: The Americas
 Atmospheric Carbon Dioxide Tagged by Source: Europe, the Middle East, and Africa.
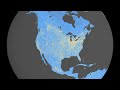 Surface Nitrogen Dioxide across North America
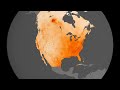 Particulate Matter 2.5 (PM2.5) across North America
 PM2.5 in the Washington D.C. region
 Surface Nitrogen Dioxide in the Washington D.C. region.
 Nitrogen Dioxide Over the United States, 2005-2022
 Relative Wetness Root Zone Versus Groundwater Comparison
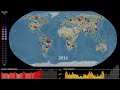 Water Cycle Extremes
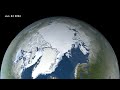 Arctic Sea Ice Minimum 2022.
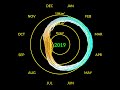 Arctic Sea Ice Spiral