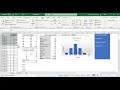
Descriptive Statistics in Excel Using the Data Analysis Tool
Use Excel to quickly calculate the Mean, Median, Mode, Standard Error, Standard Deviation, Variance, Kurtosis, Skewness, Range, Minimum, and Maximum. This video shows you how to calculate Descriptive Statistics using the Data Analysis Tool in Excel. I also demonstrate how to install the Tool if it is not already on your Excel Ribbon.
If you enjoyed this video please visit my channel page for more videos and please subscribe, I really appreciate it!
YouTube Channel: https://bit.ly/3a7equ0
Видео Descriptive Statistics in Excel Using the Data Analysis Tool канала Learn Something
If you enjoyed this video please visit my channel page for more videos and please subscribe, I really appreciate it!
YouTube Channel: https://bit.ly/3a7equ0
Видео Descriptive Statistics in Excel Using the Data Analysis Tool канала Learn Something
Показать
Комментарии отсутствуют
Информация о видео
Другие видео канала
 Statistics in Excel Tutorial 1.1. Descriptive Statistics using Microsoft Excel
 Statistics in Excel - Mean (Average), Median, Mode, and Standard Deviation
 Statistics made easy ! ! ! Learn about the t-test, the chi square test, the p value and more
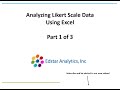 How to analyze Likert-Scale Survey Data Using Excel: Part 1
 The Excel Quick Analysis Tool
 Introduction to Descriptive Statistics
 How to Download & Prepare Survey Data for Analysis in Excel
 Excel 2013 Statistical Analysis #01: Using Excel Efficiently For Statistical Analysis (100 Examples)
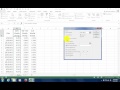 Descriptive Statistics in Excel with Data Analysis Toolpak
 Use Excel 2016 to make Frequency distribution and Histogram for quantitative data
 Excel Statistics Series: Descriptive Statistics in Excel for Mac
 SPSS Tutorial for data analysis | SPSS for Beginners
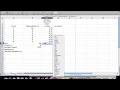 How to calculate Standard Deviation, Mean, Variance Statistics, Excel
 Introduction to Pivot Tables, Charts, and Dashboards in Excel (Part 1)
 Multiple Regression in Excel
 How to tabulate, analyze, and prepare graph from Likert Scale questionnaire data using Ms Excel.
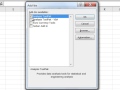 How to Install the Data Analysis ToolPak in Microsoft Excel
 Calculating Mean, Median, Mode, & Standard Deviation in Excel
 Creating a Boxplot in Excel 2016
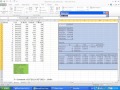 Using Multiple Regression in Excel for Predictive Analysis