Statistics in Excel - Mean (Average), Median, Mode, and Standard Deviation
Check out our brand-new Excel Statistics Text: https://www.amazon.com/dp/B076FNTZCV
Learn how to quickly calculate the mean, median, mode, standard deviation and other descriptive statistics in Excel using the Data Analysis ToolPak.
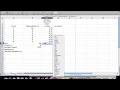
Video Transcript: In this video we'll take a look at how to run descriptive statistics in Microsoft Excel using the Data Analysis Toolpak. So here we have a single variable college GPA and we have the GPA values for 30 people on this variable. So to run descriptive statistics we want to go to Data and then Data Analysis and here we want to select Descriptive Statistics and then click OK. And here in the Input Range we'll go ahead and grab all these values including the label college GPA. OK that looks good. And then we want to select Labels in First Row. And it's very important here to get the descriptive statistics, we want to make sure that we select Summary Statistics. Go ahead and click OK. And here we get our output and what I'd like to do first of all is increase the font here. So let's increase that to 14 point font, and then we'll expand these columns so we can see this easier. I'm going to select these values here and dial down the decimal places to 2. OK that looks good. So next we'll talk about some of the key statistics that are often reported, although we won't cover every one of these in this video. So let's start down here let's start with his bottom five. And I can put some notes here for each of these. So the Count is just the total number of values in the data set. It's equal to n; we have 30 people in this data set. And then the sum is just adding all the GPA values together. So if we go back to our worksheet, if I add up all 30 values of GPA, that will give me the sum of 98.61. Then these next two values can be quite useful, they're the Minimum and the Maximum, or the lowest GPA value and the highest GPA value. And they can be useful as a quick check to make sure our data entry appears to be accurate. And what I mean by that is, it's GPA we're talking about here, so if I saw a maximum GPA of let's say 8, I would know that there's a problem with the data entry, somehow a mistake was made and an incorrect value was entered. Or likewise if I had a minimum value of say -2, since there's no such thing as a negative GPA, that would indicate that something went wrong and I'd want to go back and look at the data to check them for accuracy to ensure that I have the correct values in there. And Range is just the highest or maximum GPA minus the minimum GPA. If we take 4-2.11, that would give me 1.89. OK next we'll talk about the measures of central tendency and that's the mean, the median, and the mode. And the mean here is equal to 3.29. The mean is equal to the arithmetic average, or the sum of the values / n. And if we use the output in this table we could also say sum, 98.61 / count, the number of observations, 30. If we take 98.61 and divide that by 30, we will get a mean of 3.29. Next for central tendency we have the Median followed by the Mode. So the median is equal to the middle value, that is, if the GPA values were ordered from lowest to highest, then the median would be the very middle GPA value. It's also known as the 50th percentile. And then the mode is the most frequently occurring value, so whichever value occurs most often in the dataset. Notice these two are equal here; both the median and the mode are equal to 3.45 in this example. And then finally we have the standard deviation. And the standard deviation is equal to .55. This can be loosely interpreted as indicating the average or typical distance that scores or values vary from the mean. So in other words, if our standard deviations .55 and our mean is 3.29, then this means that the standard or typical distance that GPA values vary or are spread from the mean is by about .55 points, whether it's .55 above 3.29, or .55 below 3.29, that captures kind of the standard or typical variation from the mean, and that's what the standard deviation means. This concludes the video on the Descriptive Statistics procedure using the Data Analysis ToolPak in Microsoft Excel. Thanks for watching.
YouTube Channel: https://www.youtube.com/user/statisticsinstructor
Channel Description: For step by step help with descriptive and inferential statistics. Subscribe today!
YouTube Channel: https://www.youtube.com/user/statisticsinstructor
Видео Statistics in Excel - Mean (Average), Median, Mode, and Standard Deviation канала Quantitative Specialists
Learn how to quickly calculate the mean, median, mode, standard deviation and other descriptive statistics in Excel using the Data Analysis ToolPak.
Video Transcript: In this video we'll take a look at how to run descriptive statistics in Microsoft Excel using the Data Analysis Toolpak. So here we have a single variable college GPA and we have the GPA values for 30 people on this variable. So to run descriptive statistics we want to go to Data and then Data Analysis and here we want to select Descriptive Statistics and then click OK. And here in the Input Range we'll go ahead and grab all these values including the label college GPA. OK that looks good. And then we want to select Labels in First Row. And it's very important here to get the descriptive statistics, we want to make sure that we select Summary Statistics. Go ahead and click OK. And here we get our output and what I'd like to do first of all is increase the font here. So let's increase that to 14 point font, and then we'll expand these columns so we can see this easier. I'm going to select these values here and dial down the decimal places to 2. OK that looks good. So next we'll talk about some of the key statistics that are often reported, although we won't cover every one of these in this video. So let's start down here let's start with his bottom five. And I can put some notes here for each of these. So the Count is just the total number of values in the data set. It's equal to n; we have 30 people in this data set. And then the sum is just adding all the GPA values together. So if we go back to our worksheet, if I add up all 30 values of GPA, that will give me the sum of 98.61. Then these next two values can be quite useful, they're the Minimum and the Maximum, or the lowest GPA value and the highest GPA value. And they can be useful as a quick check to make sure our data entry appears to be accurate. And what I mean by that is, it's GPA we're talking about here, so if I saw a maximum GPA of let's say 8, I would know that there's a problem with the data entry, somehow a mistake was made and an incorrect value was entered. Or likewise if I had a minimum value of say -2, since there's no such thing as a negative GPA, that would indicate that something went wrong and I'd want to go back and look at the data to check them for accuracy to ensure that I have the correct values in there. And Range is just the highest or maximum GPA minus the minimum GPA. If we take 4-2.11, that would give me 1.89. OK next we'll talk about the measures of central tendency and that's the mean, the median, and the mode. And the mean here is equal to 3.29. The mean is equal to the arithmetic average, or the sum of the values / n. And if we use the output in this table we could also say sum, 98.61 / count, the number of observations, 30. If we take 98.61 and divide that by 30, we will get a mean of 3.29. Next for central tendency we have the Median followed by the Mode. So the median is equal to the middle value, that is, if the GPA values were ordered from lowest to highest, then the median would be the very middle GPA value. It's also known as the 50th percentile. And then the mode is the most frequently occurring value, so whichever value occurs most often in the dataset. Notice these two are equal here; both the median and the mode are equal to 3.45 in this example. And then finally we have the standard deviation. And the standard deviation is equal to .55. This can be loosely interpreted as indicating the average or typical distance that scores or values vary from the mean. So in other words, if our standard deviations .55 and our mean is 3.29, then this means that the standard or typical distance that GPA values vary or are spread from the mean is by about .55 points, whether it's .55 above 3.29, or .55 below 3.29, that captures kind of the standard or typical variation from the mean, and that's what the standard deviation means. This concludes the video on the Descriptive Statistics procedure using the Data Analysis ToolPak in Microsoft Excel. Thanks for watching.
YouTube Channel: https://www.youtube.com/user/statisticsinstructor
Channel Description: For step by step help with descriptive and inferential statistics. Subscribe today!
YouTube Channel: https://www.youtube.com/user/statisticsinstructor
Видео Statistics in Excel - Mean (Average), Median, Mode, and Standard Deviation канала Quantitative Specialists
Показать
Комментарии отсутствуют
Информация о видео
6 октября 2014 г. 20:00:01
00:04:49
Другие видео канала
 Calculating Mean, Median, Mode, & Standard Deviation in Excel
 Excel Tutorial - Descriptive Statistics for Multiple Variables
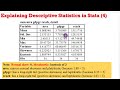 (Stata13):Interpret Descriptive Statistics #descriptivestats #interpret #stata #output
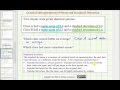 Ex: Interpret the Mean and Standard Deviation of Two Data Sets
 Use Excel 2016 to make Frequency distribution and Histogram for quantitative data
 MS Excel - Consolidation
 Microsoft Excel data analysis tool for statistics mean, median, hypothesis, regression
 Excel 2010: Percentiles and Quartiles Using Formulas
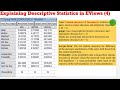 (EViews10):Interpret Descriptive Statistics #descriptivestats #interpret #eviews #output
 Descriptive Statistics in Excel Mean, Median, Mode, Std. Deviation,...
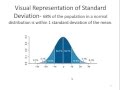 Introduction to Descriptive Statistics
 Covariance and correlation in Excel data analysis add in
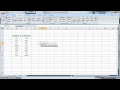 t-test in Microsoft Excel
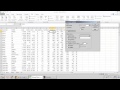 Descriptive Statistics - Excel Data Analysis ToolPak
 How to calculate Standard Deviation, Mean, Variance Statistics, Excel
 Five Number Summary and Boxplots in Excel 2016
 Interpreting the mean, median and mode
 Descriptive Statistics in Excel Using the Data Analysis Tool
 How To Find Mean,Median, Mode and Standard Deviation In Excel || Also Showing Statistical Chart.