Excel 2013 Statistical Analysis #01: Using Excel Efficiently For Statistical Analysis (100 Examples)
Download File: https://people.highline.edu/mgirvin/AllClasses/210Excel2013/Ch00/Excel2013StatisticsChapter00.xlsx
Intro To Excel: Store Raw Data, Data Types, Data Analysis, Formulas, PivotTables, Charts, Keyboards, Number Formatting, Data Analysis & More:
(00:08) Introduction to class
(00:49) Cells, Worksheets, Workbooks, File Names
(02:54) Navigating Worksheets & Workbook
(03:58) Navigation Keys
(04:15) Keyboard move Active Sheet
(05:40) Ribbon Tabs
(06:25) Add buttons to Quick Access Tool Bar
(07:40) What Excel does: Store Raw Data, Make Calculations, Data Analysis & Charting
(08:55) Introduction to Data Analysis
(10:37) Data Types in Excel: Text, Numbers, Boolean, Errors, Empty Cells
(11:16) Keyboard Enter puts content in cell and move selected cell down
(13:00) Data Type DEFAULT Alignments
(13:11) First Formula. Entering Cell References in formulas
(13:35) Keyboard Ctrl + Enter puts content in cell & keep cell selected
(14:45) Why we don’t override DEFAULT Alignments
(15:05) Keyboard Ctrl + Z is Undo
(17:05) Proper Data Sets & Raw Data
(24:21) How To Enter Data & Data Labels
(24:21) Stylistic Formatting
(26:35) AVERAGE Function
(27:31) Format Formulas Differently than Raw Data
(28:30) Keyboard Ctrl + C is Copy. Keyboard Ctrl + V is Paste
(29:59) Use Eraser remove Formatting Only
(29:19) Keyboard Ctrl + B adds Bold
(29:57) Excel’s Golden Rule
(31:43) Keyboard F2 puts cell in Edit Mode
(32:01) Violating Excel’s Golden Rule
(34:12) Arrow Keys to put cell references in formulas
(35:40) Full Discussion about Formulas & Formulas Elements
(37:22) SUM function Keyboard is Alt + =
(38:22) Aggregate functions
(38:50) Why we use ranges in functions
(40:56) COUNT & COUNTA functions
(42:47) Edit Formula & change cell references
(44:18) Absolute & Relative Cell References
(45:52) Use Delete Key, Not Right-click Delete
(46:40) Fill Handle & Angry Rabbit to copy formula
(47:41) Keyboard F4 Locks Cell Reference (make Absolute)
(49:45) Keyboard Tab puts content in Cell and move selected Cell to right
(50:55) Order of Operation error
(52:17) Range Finder to find formula errors
(52:34) Lock Cell Reference after you put cell in Edit Mode
(53:58) Quickly copy an edited formula down a column
(53:07) F2 key in last cell to find formula errors
(54:15) Fix incorrect range in function
(54:55) SQRT function & Fractional Exponents
(57:20) STDEV.P function
(58:10) Navigate Large Data Sets
(58:48) Keyboard Ctrl + Arrow jumps to bottom of data set
(59:42) Keyboard Ctrl + Shift + Arrow selects to bottom of data set (Current Range)
(01:01:41) Keyboard Shift + Enter puts content in Cell and move selected Cell up
(01:02:55) Counting with conditions or criteria: COUNTIFS function
(01:03:43) Keyboard Ctrl + Backspace jumps back to Active Cell
(01:05:31) Counting between an upper & lower limit with COUNTIFS
(01:07:36) COUNTIFS copied down column
(01:10:08) Joining Comparative Operator with Cell Reference in formula
(01:12:50) Data Analysis features in Excel
(01:13:44) Sorting
(01:16:59) Filtering
(01:20:39) Introduction to PivotTables
(01:23:39) Create PivotTable dialog box
(01:24:33) Dragging & dropping Fields to create PivotTable
(01:25:31) Dragging Field to Row area creates a Unique List
(01:26:17) Outline/Tabular Layout
(01:27:00) Value Field Settings dialog to change: Number Formatting, Function, Name
(01:28:12) 2nd & 3rd PivotTable examples
(01:31:23) What is a Cross Tabulated Report?
(01:33:04) Create Cross Tabulated Report w PivotTable
(01:35:05) Show PivotTable Field List
(01:36:48) How to Pivot the Report
(01:37:50) Summarize Survey Data with PivotTable.
(01:38:34) Keyboard Alt, N, V opens PivotTable dialog box
(01:41:38) PivotTable with 3 calculations: COUNT, MAX & MIN
(01:43:25) Count & Count Number calculations in a PivotTable
(01:45:30) Excel 2013 Charts to Visually Articulate Quantitative Data
(01:47:00) #1 Rule for Charts: No Chart Junk!
(01:47:30) Explain chart types: Column, Bar, Pie, Line and X-Y Scatter Chart
(01:51:34) Create Column Chart using Recommended Chart feature
(01:53:00) Remove Field Buttons from Pivot Chart
(01:54:10) Chart Formatting Task Pane
(01:54:45) Vary Fill Color by point
(01:55:15) Format Axis with Numbers by Formatting Source Data in PivotTable
(01:56:02) Add Data Labels to Chart
(01:57:28) Copy Chart & Create Bar Chart
(01:57:48) Change Chart Type
(01:58:15) Change Gap Width.
(01:59:17) Create Pie Chart
(01:59:23) Do NOT use 3-D Pie
(01:59:42) Add % Data Labels to Pie Chart
(02:00:25) Create Line Chart From PivotTable
(02:01:20) Link Chart Tile to Cell
(02:02:20) Move a Chart
(02:02:33) Create an X-Y Scatter Chart
(02:03:35) Add Axis Labels
(02:05:27) Number Formatting to help save time
(02:07:24) Number Formatting is a Façade
(02:10:27) General Number Format
(02:10:52) Percentage Number Formatting
(02:14:03) Don’t Multiply Relative Frequency by 100
(02:17:27) Formula for % Change & End Amount
Видео Excel 2013 Statistical Analysis #01: Using Excel Efficiently For Statistical Analysis (100 Examples) канала ExcelIsFun
Показать
Комментарии отсутствуют
Информация о видео
Другие видео канала
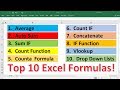 Top 10 Most Important Excel Formulas - Made Easy!
 Excel for Accounting: Formulas, VLOOKUP & INDEX, PivotTables, Recorded Macros, Charts, Keyboards
 Highline Excel 2016 Class 03: Data Analysis Fundamentals: PivotTables, Power Query & Data Model
 Statistical Data Analysis in Excel
 Excel 2016 Advanced
 Data Analytics In Excel Full Course | Data Analytics Course For Beginners | Simplilearn
 Excel Data Analysis Class 01: PivotTables, Power Query, Formulas and Charts
 Excel 2013 Statistical Analysis #06: Frequency Distributions & Column Charts, Categorical Variables
 Excel 2013 Statistical Analysis #8: Frequency Distributions, Histograms, Skew, Quantitative Variable
 Excel for Accountants: PivotTables, Power Query, IF, SUMIFS, VLOOKUP, Flash Fill, Charts…CWU Seminar
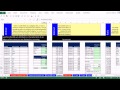 Excel 2013 Statistical Analysis #5 Data Categorical, Quantitative, Nominal, Ordinal, Interval, Ratio
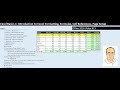 Excel Basics 1: Introduction To Excel 1: Formatting, Formulas, Cell References, Page Setup
 Excel 2013 Statistical Analysis #4: What Is / Are Statistics? Download Stock Data Create Information
 Excel Statistics Series: Descriptive Statistics in Excel for Mac
 VLOOKUP or XLOOKUP for Currency Conversion in Excel Formula? Excel Magic Trick 1758
 Advanced Excel - Data Validation and Drop-Down Lists
 Master the MOST POPULAR Excel Formulas and Functions
 VLOOKUP, MAP & LAMBDA functions to spill a Two-Way Lookup Formula Excel Magic Trick 1760
 Very Beginner Excel Tutorial for Aspiring Actuaries