Statistical Data Analysis in Excel
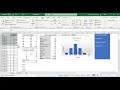
This video will show you how to use some basic statistical functions in Microsoft Excel, including calculating the Mean, Median, Mode, Max, Min, Range, and Standard Deviation for a data set, as well as how to create a frequency table and histogram. This video is an instruction manual for my engineering students, so if you are using this for your own knowledge, please excuse the sections on saving, exporting, and submitting.
Видео Statistical Data Analysis in Excel канала Mr. Dillman's Tech Channel
Видео Statistical Data Analysis in Excel канала Mr. Dillman's Tech Channel
Показать
Комментарии отсутствуют
Информация о видео
27 октября 2019 г. 21:45:51
00:11:59
Другие видео канала
 Statistics in Excel Tutorial 1.1. Descriptive Statistics using Microsoft Excel
 Statistics made easy ! ! ! Learn about the t-test, the chi square test, the p value and more
 Correlation and Regression: Simplest Way To Learn With Examples
 Introduction to Pivot Tables, Charts, and Dashboards in Excel (Part 1)
 Teach me STATISTICS in half an hour!
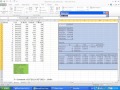 Using Multiple Regression in Excel for Predictive Analysis
 How to Do a T-Test for Beginners
 Excel - One-Way ANOVA Analysis Toolpack
 Excel 2013 Statistical Analysis #8: Frequency Distributions, Histograms, Skew, Quantitative Variable
 Descriptive Statistics in Excel Using the Data Analysis Tool
 Microsoft Excel Tutorial - Beginners Level 1
 Statistical Data Analysis in Google Sheets
 01 How to Use SPSS - An Introduction to SPSS for Beginners
 t-test in Microsoft Excel
 Statistical Tests: Choosing which statistical test to use
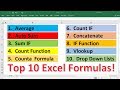 Top 10 Most Important Excel Formulas - Made Easy!
 Using the New IFS Function in Excel
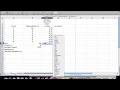 How to calculate Standard Deviation, Mean, Variance Statistics, Excel
 Excel 2013 Statistical Analysis #01: Using Excel Efficiently For Statistical Analysis (100 Examples)
 The Beginner's Guide to Excel - Excel Basics Tutorial