Correlation and Regression: Concepts with Illustrative examples
Hello Friends,
In this video, we are going to learn Correlation and Regression with the help of practical examples In Excel.
As seen in the last video, we can use scatter plots to understand the relationships between variables, but it is applied only for obvious relationships like Temperature and Viscosity. Sometimes, it is not possible to comment on the relationship between variables only by looking at the graph. In such a case, Correlation and Regression come into the picture.
The “CORRELATION & REGRESSION” are very important mathematical concepts to define the relationship between variables.
This video consists of the following points:
✅Introduction: Why Correlation and Regression are needed?
✅Correlation
✅Correlation Analysis
✅Correlation Coefficient
✅Calculation of Correlation Coefficient
✅Correlation Coefficient In Excel
✅Regression
✅Regression In Excel
✅R-Square value
✅Significance F and P-value
✅Coefficients
✅Residuals
✅Conclusion
✅Correlation and Regression
Some important links about LEARN & APPLY:
🏫 Know about LEARN & APPLY: https://www.learnandapply.org/
📱 Download our Mobile Application: https://vijaysabale.co/application
👨🏽🏫 Know about Myself (Trainer/Coach): https://vijaysabale.com/
📈 Register for Lean Six Sigma Green Belt & Black Belt Training: https://vijaysabale.co/training
🎥 Step 1- Register for my next LIVE Masterclass: https://vijaysabale.co/webinar
👨👩👦👦 Step 2- Join my community: https://vijaysabale.co/Join
You can also visit our Learning Management System (LMS) 📚📖📑 to access online courses at:
https://successfulcareerhub.com/
Join this channel to get access to perks:
https://www.youtube.com/channel/UCO-1k9_1sWVP3-wHtBAHpig/join
0:00 Introduction
0:41 Correlation
1:56 Correlation Analysis
2:05 Correlation Coefficient
2:48 Calculation of Correlation Coefficient
3:06 Correlation Coefficient In Excel
4:28 Regression
5:45 Regression In Excel
6:40 R-Square
6:56 Significance F and P-value
7:41 Coefficients
8:08 Residuals
8:44 Conclusion
8:55 Correlation and Regression
Here are the links for online courses with practical examples to understand Lean Six Sigma Concepts in Excel and Minitab:
MSA (Measurement System Analysis): https://bit.ly/3pjtUjo
Process Capability Analysis: https://bit.ly/2Mj5Nm7
7 QC (Basic Quality Control Tools): https://bit.ly/2Y7I770
Hypothesis Testing: https://bit.ly/2YchsWI
7 Advance Tools (Management & Planning Tools): https://bit.ly/3sML370
Correlation and Regression: https://bit.ly/3pjnn84
Control Chart- Powerful tool in data analysis: https://bit.ly/3c7Pgwn
And finally, thank you for watching…
#Correlation #Regression #CorrelationAnalysis #RegressionAnalysis #CorrelationAndRegression #CorrelationAndRegressionAnalysis #CorrelationExample #RegressionExample #CorrelationInExcel #RegressionInExcel #CorrelationAndRegressionExcel #LeanSixSigma #SixSigma #SixSigmaTraining #SixSigmaCertification #SixSigmaOnline #RegressionEquation #pValue #CorrelationCoefficient #RSquare #Residual #SignificanceF #RegressionAndCorrelationStatistics #CorrelationAndRegressionStatistics
Видео Correlation and Regression: Concepts with Illustrative examples канала LEARN & APPLY : Lean and Six Sigma
Показать
Комментарии отсутствуют
Информация о видео
26 августа 2017 г. 23:32:02
00:09:50
Другие видео канала
 Statistics 101: Linear Regression, The Very Basics 📈
 Correlation Coefficient
 Using Multiple Regression in Excel for Predictive Analysis
 The Normal Distribution and the 68-95-99.7 Rule (5.2)
 Correlation & Regression: illustration with Example in 60 Minutes
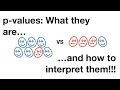 p-values: What they are and how to interpret them
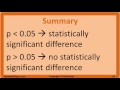 Null Hypothesis, p-Value, Statistical Significance, Type 1 Error and Type 2 Error
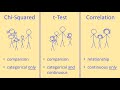 Choosing a Statistical Test for Your IB Biology IA
 Statistics made easy ! ! ! Learn about the t-test, the chi square test, the p value and more
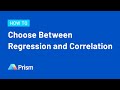 How to Choose Between Regression and Correlation
 Intro to Hypothesis Testing in Statistics - Hypothesis Testing Statistics Problems & Examples
 What is Regression? | SSE, SSR, SST | R-squared | Errors (ε vs. e)
 SPSS Tutorial for data analysis | SPSS for Beginners
 Teach me STATISTICS in half an hour!
 Calculating Correlation (Pearson's r)
 StatQuest: Logistic Regression
 Statistical Tests: Choosing which statistical test to use
 Linear Regression and Correlation - Example
 How to find the regression line by Hand