Statistics in Excel Tutorial 1.1. Descriptive Statistics using Microsoft Excel
This video tutorial describes how to compute Descriptive Statistics in Excel. Most people underestimate the power and use of microsoft Excel for Statistical analysis. Excel can very quickly generate statistics, percentiles and can do variety of statistical tasks in excel including hypothesis testing and running t-tests as well.
in this video, we compute measures of central tendency, measures of dispersion, measures of location such as percentiles. We generate, mean, median, mode, percentiles, Frequency table and also histogram. Using these methods one can summarize the data quickly.
Видео Statistics in Excel Tutorial 1.1. Descriptive Statistics using Microsoft Excel канала CXOLearningAcademy
Показать
Комментарии отсутствуют
Информация о видео
Другие видео канала
 Excel 2013 Statistical Analysis #01: Using Excel Efficiently For Statistical Analysis (100 Examples)
 Statistics Using Excel Tutorial 1.2 Computing Probabilities for Binomial and Poisson Distribution
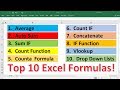 Top 10 Most Important Excel Formulas - Made Easy!
 Excel Statistics Series: Descriptive Statistics in Excel for Mac
 Easiest Way To Start Dropshipping From Scratch (Exactly What I Did)
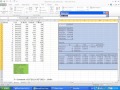 Using Multiple Regression in Excel for Predictive Analysis
 Calculating Mean, Median, Mode, & Standard Deviation in Excel
 Use Excel 2016 to make Frequency distribution and Histogram for quantitative data
 Descriptive Statistics in Excel Using the Data Analysis Tool
 Business Analytics with Excel | Data Science Tutorial | Simplilearn
 How to Download & Prepare Survey Data for Analysis in Excel
 t-test in Microsoft Excel
 Introduction to Pivot Tables, Charts, and Dashboards in Excel (Part 1)
 Descriptive Statistics in Excel
 Introduction to Descriptive Statistics
 Ogive (Cumulative Frequency Graph) using Excel's Data Analysis
 Multiple Regression in Excel
 Creating a Boxplot in Excel 2016
 How to Calculate a Correlation in Microsoft Excel - Pearson's r
 Using Excel to Compute Grouped Mean and Standard Deviation