The Excel Quick Analysis Tool
Learn how to use the Excel Quick Analysis Tool to quickly add colorful visuals to your spreadsheets. The visuals include colorful conditional formatting, charts, icon sets, pivot tables, sparklines, and more. ***Consider supporting Technology for Teachers and Students on Patreon***: https://www.patreon.com/technologyforteachersandstudents See my entire playlist of Excel videos: http://bit.ly/tech4excel Here's the practice file that goes with the video: https://bit.ly/excelquick #excel #exceltutorial
Видео The Excel Quick Analysis Tool канала Technology for Teachers and Students
Видео The Excel Quick Analysis Tool канала Technology for Teachers and Students
Показать
Комментарии отсутствуют
Информация о видео
20 июля 2020 г. 19:09:18
00:05:21
Другие видео канала
 Advanced Excel - Creating Pivot Tables in Excel
 Descriptive Statistics in Excel Using the Data Analysis Tool
 20 Excel Tricks for Data Analysis | Excel Tutorials
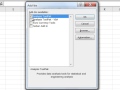 How to Install the Data Analysis ToolPak in Microsoft Excel
 Excel: INDEX and MATCH
 Excel Frequency Function
 Top 25 Excel 2016 Tips and Tricks
 Excel Quick Tip: Using the Quick Analysis Tool
 The Function Keys in Excel
 Introduction to Pivot Tables, Charts, and Dashboards in Excel (Part 1)
 Creating Easy Data Entry Forms in Excel
 Top 10 Most Important Excel Formulas - Made Easy!
 How to Extract Data from a Spreadsheet using VLOOKUP, MATCH and INDEX
 Using Excel Hyperlinks
 Mail Merge from Excel to Microsoft Word
 10 Super Neat Ways to Clean Data in Excel
 Beginner's Guide to Excel Dashboards
 Excel Double Mouse Click Tricks
 Excel Relative vs Absolute Cell References
 Business Analytics with Excel | Data Science Tutorial | Simplilearn