Descriptive Statistics in Excel with Data Analysis Toolpak
#excel #dataanalysis #toolpak
Please SUBSCRIBE:
https://www.youtube.com/subscription_center?add_user=mjmacarty
https://alphabench.com/data/excel-descriptive-statistics.html
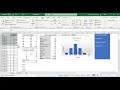
Generate a table of descriptive statistics in Excel for Windows and Excel 2016 for the MAC with the Data Analysis Toolpak Addin.
Descriptive statistics or simply descriptives are used to characterize data sets with summary measurements that act as a simple way to summarize data. Descriptives along with a visualization of a data set are the first steps in any data analysis.
Видео Descriptive Statistics in Excel with Data Analysis Toolpak канала Matt Macarty
Please SUBSCRIBE:
https://www.youtube.com/subscription_center?add_user=mjmacarty
https://alphabench.com/data/excel-descriptive-statistics.html
Generate a table of descriptive statistics in Excel for Windows and Excel 2016 for the MAC with the Data Analysis Toolpak Addin.
Descriptive statistics or simply descriptives are used to characterize data sets with summary measurements that act as a simple way to summarize data. Descriptives along with a visualization of a data set are the first steps in any data analysis.
Видео Descriptive Statistics in Excel with Data Analysis Toolpak канала Matt Macarty
Показать
Комментарии отсутствуют
Информация о видео
Другие видео канала
 Statistics in Excel Tutorial 1.1. Descriptive Statistics using Microsoft Excel
 How to do Linear Regression with Excel Data Analysis Toolpak
 Descriptive Statistics Explained! Basic Data Analysis in Excel
 How To Perform Descriptive Statistics In Excel (Very Easy!)
 Using Microsoft Excel for Chi-Square Test (Nonparametric Test)
 Descriptive Statistics in Excel
 Excel 2016 Data Analysis ToolPak Histograms and Percent Polygons
 Excel Interview Questions For Data Analyst
 JASP/Excel - Mediation Analyses Example
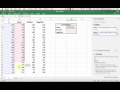 Using Excel to calculate a correlation coefficient || interpret relationship between variables
 Descriptive Statistics in Excel Using the Data Analysis Tool
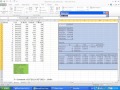 Using Multiple Regression in Excel for Predictive Analysis
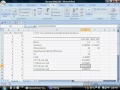 Performing an independent samples t test in Excel
 Kolmogorov-Smirnov Test of Normality in Excel
 Microsoft excel from beginner to advanced (full course) - in Amharic
 Excel 2013 PowerPivot Basics #04: DAX Formulas Can Be Easier & Faster Than Array Formulas
 Use Excel 2016 to make Frequency distribution and Histogram for quantitative data
 Excel Tutorial for Beginners in Hindi - Complete Microsoft Excel tutorial in Hindi for Excel users
 Checking that data is normally distributed using Excel