How to tabulate, analyze, and prepare graph from Likert Scale questionnaire data using Ms Excel.
This video describes the procedure of tabulating and analyzing the likert scale survey data using Microsoft Excel. This video also explains how to prepare graph from the tabulated data.
Photo courtesy: http://littlevisuals.co/
Видео How to tabulate, analyze, and prepare graph from Likert Scale questionnaire data using Ms Excel. канала Edifo
Photo courtesy: http://littlevisuals.co/
Видео How to tabulate, analyze, and prepare graph from Likert Scale questionnaire data using Ms Excel. канала Edifo
Показать
Комментарии отсутствуют
Информация о видео
Другие видео канала
 How to transfer data from a questionnaire to the SPSS file?
 Stacked Bar Charts for Likert Data
 HOW TO COMPUTE LIKERT SCALE, T-TEST & PEARSON R
 SPSS: How to Analyse and Interpret LIKERT-SCALE Questionnaire Using SPSS
 Analysing Questionnaires
 How to analyze data in Excel for Likert Scale Questions
 Charting Survey Results in Excel (Visualize Employee Satisfaction results)
 How to create a table from survey data in Excel | Questionnaires & pivot tables for beginners
 #5-pointLikertScale How to Use Likert Scale in Descriptive Study
 Ranking Scale Questionnaire - How to tabulate, analyse and prepare graph using MS Excel.
 HOW TO USE EXCEL TO TABULATE SURVEY RESULTS
 How to enter survey data into Excel from a pen-and-paper questionnaire
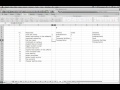 Part 1 - Using Excel for Open-ended Question Data Analysis
 THE BEST WAY TO ANALYSE YOUR LIKERT SCALE QUESTIONNAIRE A MUST FOR ALL POSTGRADUATES TO WATCH
 HOW TO INTERPRET LIKERT SCALE RESULTS
 How to Download & Prepare Survey Data for Analysis in Excel
 Likert Scale Analysis - Mean and Standard Deviation
 One Sample Chi-Square Test from questionnaire data using Microsoft Excel and Reporting in APA format
 How to create figures in Excel: Survey/questionnaire results/data | APA Style graphs
 (18E) Analysis of Likert Data