6 advanced Excel charts that show variance in financial reporting
This video shows you six advanced charts created in Excel that you can use to report variance between actual results and budget, forecast, or last year. You will also see some of the expert-level techniques used to create the charts in Excel. If you want to get a template for each visual and learn all of the techniques to create these charts, check out the FinancialViz Excel Techniques Online Course: Reporting variance in financial results with advanced Excel charts at www.FinancialViz.com.
Видео 6 advanced Excel charts that show variance in financial reporting канала ThinkOutsideTheSlide.com
Видео 6 advanced Excel charts that show variance in financial reporting канала ThinkOutsideTheSlide.com
Показать
Комментарии отсутствуют
Информация о видео
Другие видео канала
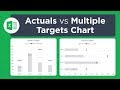 Actual vs Targets Chart in Excel
 How to build Interactive Excel Dashboards that Update with ONE CLICK!
 AWESOME Excel Charts & Visuals | For Business & Finance Professionals
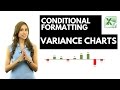 Excel Variance Charts: Actual to Previous Year or Budget Comparisons
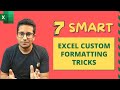 7 Clever Excel Custom Formatting Tricks (Advanced)
 Excel PivotTables Made Easy - And Why Things Go Wrong!
 25 Advanced Excel Chart Tips and Tricks
 Dynamic Variance Arrows Chart with Check Boxes
 Secrets to Building Excel Dashboards in Under 15 Minutes!
 Target Chart 2 - for Unique Targets
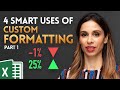 4 SMART Ways to use Custom Formatting instead of Conditional Formatting in Excel - Part 1
 Simple Excel Trick to Conditionally Format Your Bar Charts
![11 Ways of Tracking Monthly Variances in FP&A [WEBINAR]](https://i.ytimg.com/vi/0OqY1-d-8nM/default.jpg) 11 Ways of Tracking Monthly Variances in FP&A [WEBINAR]
11 Ways of Tracking Monthly Variances in FP&A [WEBINAR] 19 Advanced Excel Shortcuts (do you know them all?)
 10 Advanced Excel Charts
 Better Excel Variance Charts to show percentage change (Simple & uncommon technique)
 How to Create an Excel Interactive Chart with Dynamic Arrays
 Excel Custom Number Formats using Conditions - Emojis, Scaling & Colors
 Interactive Personal Finance Dashboard
 This Excel Chart will grab your attention (Infographic template included)