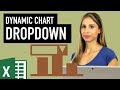
How to Create an Excel Interactive Chart with Dynamic Arrays
Quickly create an automatically sorted Excel bar chart that ALSO lets you hide and show categories on the chart based on a flag in the cell. It's super easy with Excel dynamic arrays - specifically with the new Excel FILTER and SORTBY functions.
This is especially useful for Excel dashboards to include interactive charts depending on a selection.
The solution will be fully dynamic, i.e. we will not use manual filter or manual hiding. We will even take it another step further and automatically sort the Excel chart based on the visible sales data.
To get that setup we will use Excel's new Dynamic Array functions exclusively available in Office
365.
To summarize what you learn:
1. How to use Excel Dynamic Array referencing in charts
2. How to use Excel FILTER & SORTBY functions
3. How to Sort categories based on their values
Step 1: Data Preparation Table (01:26)
Whenever the chart has a different setup than the source data, a data preparation table is needed in between. We will use the new Excel FILTER function for that. In order to get the chart properly sorted we will apply the new Excel SORTBY function. This function is used when the sorting criteria is not in the result. The tricky part is to ensure that the array for the sorting (by_array1) has the same size and order as the array for the visible sales data. We will solve this by nesting another FILTER function in the formula. To get the respective sales data we'll use a simple VLOOKUP.
Step 2: Excel Chart (06:30)
For the visualization we'll use a column chart that's connected to the data preparation table. However, we want the Excel chart area to update automatically based on the number of data points in the data preparation table. In other words, we want the chart to be dynamic and to include any new selections from the data preparation table and exclude any blank areas.
Excel Chart references can either take direct references or they can take names. Therefore, to keep the chart dynamic we'll use names in the Name Manager and we'll use the "#" for the reference to spill. Then we'll update the Series Values and the Axis Labels of the chart with the names we created.
Step 3: Dynamic Dashboard (09:38)
This technique can easily be used to create dynamic dashboards. Based on a dropdown selection the chart is automatically updated. I used the Excel IF and SUMPRODUCT functions to help with that. In order to make sure that new data is added to the chart I converted the data into an official Excel table.
By combining the power of Excel tables and the new Excel Dynamic Arrays such dashboards can be created really fast.
00:00 Intro
01:26 Prepare Data Table
06:30 Create Excel Chart
09:38 Setup Dynamic Excel Dashboard
⯆ DOWNLOAD the workbook here: https://www.xelplus.com/excel-da-dynamic-sorted-chart
LINKS to Excel Dynamic Arrays Playlist: https://www.youtube.com/playlist?list=PLmHVyfmcRKyyPFY31LldHWcJdLzGUPTSP
Excel Dashboards & Reports Playlist: https://www.youtube.com/playlist?list=PLmHVyfmcRKyz_4TwSfxzN_gsRtg3ODzyx
★ My Online Excel Courses ► https://www.xelplus.com/courses/
✉ Not sure which of my Excel courses fits best for you? Take the quiz: https://www.xelplus.com/course-quiz/
EXCEL RESOURCES I Recommend: https://www.xelplus.com/resources/
Get Office 365: https://microsoft.msafflnk.net/15OEg
Microsoft Surface: https://microsoft.msafflnk.net/c/1327040/451518/7593
GEAR
Screen recorder: http://techsmith.pxf.io/c/1252781/347799/5161
Main Camera: https://amzn.to/3a5ldBs
Backup Camera: https://amzn.to/2FLiFho
Main Lens: https://amzn.to/39apgeD
Zoom Lens: https://amzn.to/3bd5pN7
Audio Recorder: https://amzn.to/2Uo5rLm
Microphone: https://amzn.to/2xYy9em
Lights: http://amzn.to/2eJKg1U
More resources on my Amazon page: https://www.amazon.com/shop/leilagharani
Let’s connect on social:
Instagram: https://www.instagram.com/lgharani
Twitter: https://twitter.com/leilagharani
LinkedIn: https://at.linkedin.com/in/leilagharani
Note: This description contains affiliate links, which means at no additional cost to you, we will receive a small commission if you make a purchase using the links. This helps support the channel and allows us to continue to make videos like this. Thank you for your support!
#MsExcel
Видео How to Create an Excel Interactive Chart with Dynamic Arrays канала Leila Gharani
Показать
Комментарии отсутствуют
Информация о видео
Другие видео канала
 Excel Dynamic Chart with Drop down List (column graph with average line)
 Secrets to Building Excel Dashboards in Under 15 Minutes!
 Excel Dynamic Arrays (How they will change EVERYTHING!)
 4 SMART Ways to use Custom Formatting instead of Conditional Formatting in Excel - Part 1
 Excel Pivot Tables EXPLAINED in 10 Minutes (Productivity tips included!)
 Pivot Table with Progress Chart and Dashboard
 Master Excel's SUMPRODUCT Formula
 This Excel Chart will grab your attention (Infographic template included)
 Build Interactive Dashboards with Dynamic Arrays
 How to build Interactive Excel Dashboards
 Create Multiple Dependent Drop-Down Lists in Excel (on Every Row)
 Excel Dashboard - Plan vs Actual Variances - FREE Download
 6 FREE Add-Ins for Excel to Start Using Now
 Excel OFFSET Function for Dynamic Calculations - Explained in Simple Steps
 Use dynamic named ranges so your charts update automatically
 Simple Excel Trick to Conditionally Format Your Bar Charts
 4 Hidden Excel Dashboard Design Tips for Beautiful Reports
 Dynamic Variance Arrows Chart with Check Boxes
 Excel FILTER Function TRICK for Non Adjacent Columns
 How Power Query Will Change the Way You Use Excel