Doughnut Chart for Excel Dashboards: Simple and Easy way! [Excel Free Template]
⚡Learn how to create a progress doughnut or ring chart in Excel. This chart displays a progress bar with the percentage of completion on a single metric. Creating an overlapped doughnut chart will help us to create an attractive ring chart for our dashboards.
⚡If you like our tutorials do not forget to subscribe to our channel and click on the bell to stay up to date with all the new tutorials that I am uploading.
⚡Every video on my channel is made with a lot of love and affection for you. If you wish you can SUBSCRIBE to my channel and leave a LIKE!
⚡ Please SUBSCRIBE FOR MORE VIDEOS THAT YOU WON'T MISS MY FUTURE TUTORIALS
⚡ https://bit.ly/2WQKad5
⚡ Download Template:
🎬 Uploading tutorials twice a week.
⚡ Also please check my previous tutorial on MS Excel from the link below:
***********************************************************
➡️Excel Gantt Chart: https://youtu.be/Wp1pZaDmJ9o
➡️HLOOKUP Explained: https://youtu.be/IEtIKIhRsxE
➡️Excel Chart Dynamic Data Label: https://youtu.be/-FwikU9IRZA
➡️Funny XY Scatter Chart: https://youtu.be/CeTNOlrr37Y
➡️Cascaded Drop-down: https://youtu.be/qdWS2odn2w0
➡️Free XLOOKUP Function Adins: https://youtu.be/-56visj94dg
➡️Radar Chart: https://youtu.be/2wqbMgULLZk
➡️Sunbust Chart: https://youtu.be/ohgna8lT3KI
➡️EOMonth Function: https://youtu.be/IM6NzPEKDZo
➡️Introduction to ABS function in Excel: https: https://youtu.be/eM6vNnO_YOU
➡️Introduction to SUMIF and SUMIFS Function: https://youtu.be/cj3ZNj_LV3Q
#MSExcel #PieChart #ExcelDashBoards #DoughnutChart #FreeTemplate #ExcelChart
Видео Doughnut Chart for Excel Dashboards: Simple and Easy way! [Excel Free Template] канала SD Motion
Показать
Комментарии отсутствуют
Информация о видео
Другие видео канала
 Excel Doughnut Chart - Conditional Formatting | FREE Download
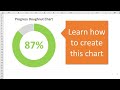 Progress Circle Chart in Excel - Part 1 of 2
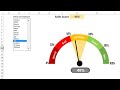 Dynamic Sales Score Meter Chart with Form Control Combo box and List box
![Excel Dashboard Chart: Circular Liquid in Chart [Download Free Template]](https://i.ytimg.com/vi/q9fT7SO1AQE/default.jpg) Excel Dashboard Chart: Circular Liquid in Chart [Download Free Template]
Excel Dashboard Chart: Circular Liquid in Chart [Download Free Template] 4 Hidden Excel Dashboard Design Tips for Beautiful Reports
 This Excel Chart will grab your attention (Infographic template included)
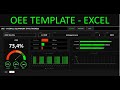 OEE Excel Template - OEE Calculator Spreadsheets
 Excel Dashboard - Plan vs Actual Variances - FREE Download
 Pivot Table with Progress Chart and Dashboard
 Progress Chart With Pivot Table and Slicer
 3D Doughnut Chart for KPI Metrics
 Excel Pivot Chart with Slicers for Months to Show Values by Weekday Names
 PowerPoint Donut Chart - Designed & Animated Template ✔
 How to create an interactive 3D Pie Chart in Excel 2016
 Advanced Excel: Using Charts and Functions to See Trends
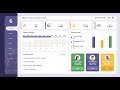 Excel Dashboard for Schools with changing students images dynamically | Video Tutorial #1
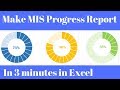 MIS Report in Excel Progress Chart
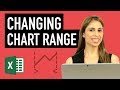 Excel Dynamic Chart Range based on Cell (drop-down) Value for dashboards
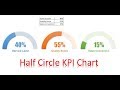 Half Circle KPI info graphic chart
 Create an Interactive Excel Dashboard In Under 3 MINUTES!