Excel Doughnut Chart - Conditional Formatting | FREE Download
Create this chart in a single click with our Add-In Pine BI:
➤ https://www.pinexl.com/pine-bi-excel-add-in
--
Learn how to create a Doughnut Chart in Excel with conditional formatting. Use it to improve data analysis and presentation, and to impress your viewers! No VBA or Macros needed. Perfect for Dynamic Dashboards!
➤ If you found this video useful, please Like, Share and Subscribe!
Need amazing Excel Dashboards and Charts? We've got you covered!
We can support you by updating your existing Spreadsheet visualizations or creating new, based on your data from scratch! For more information, visit our Services page:
➤ https://www.pinexl.com/consulting
Check out our premium Excel Templates, including our KPI Dashboard Template featured in the video:
➤ https://www.pinexl.com/product-page/kpi-dashboard
Download for FREE – this Excel chart is available with instructions at:
➤ https://www.pinexl.com/excel-doughnut-chart-tutorial
Follow us on:
➤ Facebook: https://www.facebook.com/Pinexl
➤ LinkedIn: https://www.linkedin.com/company/Pinexl
Modern & Professional. No Macros. Completely Unlocked.
Music: www.bensound.com
Видео Excel Doughnut Chart - Conditional Formatting | FREE Download канала Pinexl
Показать
Комментарии отсутствуют
Информация о видео
Другие видео канала
![Doughnut Chart for Excel Dashboards: Simple and Easy way! [Excel Free Template]](https://i.ytimg.com/vi/PcnLu4yzH_Q/default.jpg) Doughnut Chart for Excel Dashboards: Simple and Easy way! [Excel Free Template]
Doughnut Chart for Excel Dashboards: Simple and Easy way! [Excel Free Template] RAG Condition Formatting in Progress Circle chart in Excel
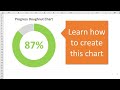 Progress Circle Chart in Excel - Part 1 of 2
 Excel Actual vs. Budget Bar Chart with Conditional Formatting | FREE Download
 Pivot Table with Progress Chart and Dashboard
 How to Create a Multi-Layer Doughnut Chart in Excel
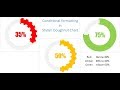 Conditional Formatting in Stylish Doughnut Chart
 7 Creating Pie Chart, Donut Chart and Race Tracks - Data Visualization in Excel Tutorial
 Simple Excel Trick to Conditionally Format Your Bar Charts
 How to Create a Progress Donut Chart in Excel – Excel Girl
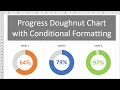 Progress Circle Chart with Conditional Formatting - Part 2 of 2
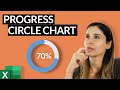 Progress Circle Chart in Excel as NEVER seen before!
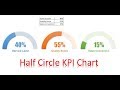 Half Circle KPI info graphic chart
 Infographics: Progress Circle Chart in Excel
 Chart in Excel - Pie Chart and Line Graph
 How to create an interactive 3D Pie Chart in Excel 2016
 Doughnut Pie Chart in Excel - Infographic
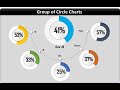 Info-graphics: Group of Circle Charts in Excel
 3D Infographic Cylinder Chart in Excel 2016
 Dynamic Performance Chart in Excel