How to make a Double Bar Graph in Excel? | Double Axis Bar Chart | Divergent Bar or Butterfly Chart
Select Double Bar Graph. Select your data. Click “Create Chart From Selection” button. You can create Double Bar Graph in a few minutes with a few clicks.
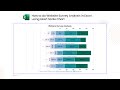
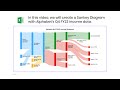
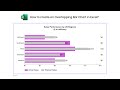
Double Bar Graph, often called a divergent bar chart or butterfly chart, which is used to compare two related groups side by side. In this case, it compares factors associated with Supplier A and Supplier B.
This chart can help in decision-making by showing which supplier excels in specific areas, depending on the priorities (e.g., higher performance or value across certain factors).
Install ChartExpo charts add-in for Microsoft Excel or Office 365
https://chartexpo.com/utmAction/MTArdXQreGwrcHBjKzUxMDIr
How to install ChartExpo add-in in Excel & Office 365 video
https://www.youtube.com/watch?v=cWKBUrdIW88
Install ChartExpo charts add-on for Google Sheets
https://chartexpo.com/utmAction/MTArdXQrZ3MrcHBjKzUxMDIr
Explore more charts and visualizations
https://chartexpo.com/?source=YouTube
Video Summary:
This video explains "How to create a Double Bar Graph in Excel?". You can use the option of properties to enhance your charts.
Chapters:
0:10 Create chart from selection.
0:33 Double Bar Graph data requirements.
2:12 How to customize a Double Bar Graph using properties?
4:09 How to export a Double Bar Graph in JPG, PNG, SVG and PDF?
4:28 How to install ChartExpo add-in for Excel & Office 365 video?
#chartexpo #datavisualization #datastorytelling #dataviz #visualization #charts #graphs #spreadsheet #excel #doublebarchart
Tags:
Custom charts
Advance charts
Professional charts
Data charting
Data visualization tools
Excel graphs
Advance Excel charts
Excel data visualization
Excel Add in
Excel chart tutorial
Excel chart tricks
Impressive Excel charts
Build Modern Excel Charts
Видео How to make a Double Bar Graph in Excel? | Double Axis Bar Chart | Divergent Bar or Butterfly Chart канала ChartExpo
Data visualizations Data storytelling Charts Graphs Excel Charts Google Sheets Charts tornado chart butterfly chart comparison chart 2 scales 2 variables chart pyramid chart tornado diagram two-sided bar chart Sensitivity Analysis 2 bar chart in excel how to make a double bar graph excel charts data charting charts in excel excel charts and graphs create a double bar graph bar graph comparison chart side by side bar chart diverging bar chart
Комментарии отсутствуют
Информация о видео
29 ноября 2024 г. 14:53:13
00:05:26
Другие видео канала