- Популярные видео
- Авто
- Видео-блоги
- ДТП, аварии
- Для маленьких
- Еда, напитки
- Животные
- Закон и право
- Знаменитости
- Игры
- Искусство
- Комедии
- Красота, мода
- Кулинария, рецепты
- Люди
- Мото
- Музыка
- Мультфильмы
- Наука, технологии
- Новости
- Образование
- Политика
- Праздники
- Приколы
- Природа
- Происшествия
- Путешествия
- Развлечения
- Ржач
- Семья
- Сериалы
- Спорт
- Стиль жизни
- ТВ передачи
- Танцы
- Технологии
- Товары
- Ужасы
- Фильмы
- Шоу-бизнес
- Юмор
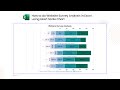
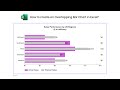
How to create a Digital Marketing Funnel in Excel? | Funnel Chart | Pyramid Chart | Funnel Diagram
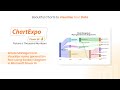
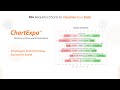
Select Funnel Chart (aka Pyramid Chart). Select your data. Click “Create Chart From Selection” button. You can create Funnel Chart (aka Pyramid Chart) in a few minutes with a few clicks.
The digital marketing funnel represents the stages a potential customer goes through before making a purchase or taking a desired action.
A Funnel Chart, also known as a Pyramid Chart, is a graphical representation that resembles the shape of a funnel where each segment gets progressively narrower. The segments are arranged vertically to showcase a hierarchy. Within the funnel chart, each segment corresponds to a step or stage in a sequential process.
Install ChartExpo charts add-in for Microsoft Excel or Office 365
https://chartexpo.com/utmAction/MTArdXQreGwrcHBjKzUyNDgr
How to install ChartExpo add-in in Excel & Office 365 video
https://www.youtube.com/watch?v=cWKBUrdIW88
Install ChartExpo charts add-on for Google Sheets
https://chartexpo.com/utmAction/MTArdXQrZ3MrcHBjKzUyNDgr
Explore more charts and visualizations
https://chartexpo.com/?source=YouTube
Video Summary:
This video explains "How to make a Digital Marketing Funnel in Excel?" You can use the option of properties to enhance your charts.
Chapters:
0:00 Data requirements for Funnel Chart (aka Pyramid Chart)
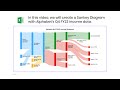
0:50 How to construct data for Funnel Chart (aka Pyramid Chart)?
1:15 How to create a Funnel Chart (aka Pyramid Chart) in Excel from worksheet data?
2:21 How to customize Funnel Chart (aka Pyramid Chart) using properties
4:12 How to export Funnel Chart (aka Pyramid Chart) in JPG, PNG, SVG or PDF
#chartexpo #charts #graphs #datavisualization #datastorytelling #dataviz #visualization
#excel #funnelchart #pyramidchart #digitalmarketing
Tags:
Custom charts
Advance charts
Professional charts
Data charting
Data visualization tools
Excel graphs
Advance Excel charts
Excel data visualization
Excel Add in
Excel chart tutorial
Excel chart tricks
Impressive Excel charts
Build Modern Excel Charts
What is Digital marketing funnel?
Funnel analysis
Conversion funnel
Sales pipeline
Customer journey
Lead generation funnel
Marketing funnel
Sales funnel
Funnel visualization
Funnel shape
Funnel stages
Funnel segmentation
Funnel bottlenecks
Funnel optimization
Funnel metrics
Funnel tracking
Funnel insights
Funnel chart examples
Funnel chart applications
Funnel chart benefits
Funnel chart analysis
Видео How to create a Digital Marketing Funnel in Excel? | Funnel Chart | Pyramid Chart | Funnel Diagram канала ChartExpo
The digital marketing funnel represents the stages a potential customer goes through before making a purchase or taking a desired action.
A Funnel Chart, also known as a Pyramid Chart, is a graphical representation that resembles the shape of a funnel where each segment gets progressively narrower. The segments are arranged vertically to showcase a hierarchy. Within the funnel chart, each segment corresponds to a step or stage in a sequential process.
Install ChartExpo charts add-in for Microsoft Excel or Office 365
https://chartexpo.com/utmAction/MTArdXQreGwrcHBjKzUyNDgr
How to install ChartExpo add-in in Excel & Office 365 video
https://www.youtube.com/watch?v=cWKBUrdIW88
Install ChartExpo charts add-on for Google Sheets
https://chartexpo.com/utmAction/MTArdXQrZ3MrcHBjKzUyNDgr
Explore more charts and visualizations
https://chartexpo.com/?source=YouTube
Video Summary:
This video explains "How to make a Digital Marketing Funnel in Excel?" You can use the option of properties to enhance your charts.
Chapters:
0:00 Data requirements for Funnel Chart (aka Pyramid Chart)
0:50 How to construct data for Funnel Chart (aka Pyramid Chart)?
1:15 How to create a Funnel Chart (aka Pyramid Chart) in Excel from worksheet data?
2:21 How to customize Funnel Chart (aka Pyramid Chart) using properties
4:12 How to export Funnel Chart (aka Pyramid Chart) in JPG, PNG, SVG or PDF
#chartexpo #charts #graphs #datavisualization #datastorytelling #dataviz #visualization
#excel #funnelchart #pyramidchart #digitalmarketing
Tags:
Custom charts
Advance charts
Professional charts
Data charting
Data visualization tools
Excel graphs
Advance Excel charts
Excel data visualization
Excel Add in
Excel chart tutorial
Excel chart tricks
Impressive Excel charts
Build Modern Excel Charts
What is Digital marketing funnel?
Funnel analysis
Conversion funnel
Sales pipeline
Customer journey
Lead generation funnel
Marketing funnel
Sales funnel
Funnel visualization
Funnel shape
Funnel stages
Funnel segmentation
Funnel bottlenecks
Funnel optimization
Funnel metrics
Funnel tracking
Funnel insights
Funnel chart examples
Funnel chart applications
Funnel chart benefits
Funnel chart analysis
Видео How to create a Digital Marketing Funnel in Excel? | Funnel Chart | Pyramid Chart | Funnel Diagram канала ChartExpo
Data visualizations Data storytelling Charts Graphs Excel Charts Google Sheets Charts What is Digital marketing funnel? marketing funnel digital marketing Sales funnel Funnel chart examples Funnel chart analysis Funnel tracking Funnel optimization Lead generation funnel Customer journey Conversion funnel Funnel analysis excel funnel graph funnel diagram funnel marketing strategy funnel marketing funnel marketing facebook funnel marketing digital
Комментарии отсутствуют
Информация о видео
8 января 2024 г. 16:28:11
00:04:39
Другие видео канала