- Популярные видео
- Авто
- Видео-блоги
- ДТП, аварии
- Для маленьких
- Еда, напитки
- Животные
- Закон и право
- Знаменитости
- Игры
- Искусство
- Комедии
- Красота, мода
- Кулинария, рецепты
- Люди
- Мото
- Музыка
- Мультфильмы
- Наука, технологии
- Новости
- Образование
- Политика
- Праздники
- Приколы
- Природа
- Происшествия
- Путешествия
- Развлечения
- Ржач
- Семья
- Сериалы
- Спорт
- Стиль жизни
- ТВ передачи
- Танцы
- Технологии
- Товары
- Ужасы
- Фильмы
- Шоу-бизнес
- Юмор
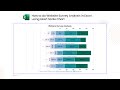
Sankey Diagram – Alphabet Q4 FY23 Income Statement | Sankey Chart in Excel | Financial Statements
In this video, we will create a Sankey Diagram with Alphabet’s Q4 FY23 income data.
A Sankey diagram for an income statement visually represents the flow of revenues and expenses, showing how they contribute to net income or loss.
In the case of Alphabet's Q4 FY23 income statement, the Sankey diagram would display the various insights:
• Alphabet's main source of revenue is advertising, particularly search advertising, contributing a substantial portion to the total revenue.
• Google Cloud and Google Play are also significant contributors to revenue.
• A large part of the expenses is attributed to R&D, highlighting Alphabet's investment in innovation and development.
• Despite high costs and expenses, Alphabet maintains a strong operating and net profit, indicating efficient cost management and high profitability.
Install ChartExpo charts add-in for Microsoft Excel or Office 365
https://chartexpo.com/utmAction/MTYrdXQreGwrY2V4cG8rNTI4MSs=
How to install ChartExpo add-in in Excel & Office 365 video
https://www.youtube.com/watch?v=cWKBUrdIW88
Install ChartExpo charts add-on for Google Sheets
https://chartexpo.com/utmAction/MTYrdXQrZ3MrY2V4cG8rNTI4MSs=
Install ChartExpo Sankey Diagram Microsoft Power BI custom visual
https://chartexpo.com/utmAction/MTYrdXQrcGIrY2V4cG8rNTI4MStTYW5rZXkr
Explore more charts and visualizations
https://chartexpo.com/charts/sankey-diagram?source=YouTube
Video Summary:
This video explains "How you can easily create a Sankey Diagram with Alphabet’s Q4 FY23 income data?" You can use the option of properties to enhance your charts.
Chapters:
0:00 Data requirements for Sankey Diagram.
0:48 How to construct data for Sankey Diagram?
1:10 How to create a Sankey Diagram in Excel from worksheet data?
2:12 How to customize Sankey Diagram using properties?
6:03 How to export Sankey Diagram in JPG, PNG, SVG or PDF?
#chartexpo #charts #graphs #datavisualization #datastorytelling #dataviz #visualization
#excel #sankeydiagram #sankeychart
Tags:
Custom charts
Advance charts
Professional charts
Data charting
Data visualization tools
Excel graphs
Advance Excel charts
Excel data visualization
Excel Add in
Excel chart tutorial
Excel chart tricks
Impressive Excel charts
Build Modern Excel Charts
Sankey Diagram
Sankey Chart
Visualize Financial Statements
Envision Income Statements
Custom charts using Excel add-in
Видео Sankey Diagram – Alphabet Q4 FY23 Income Statement | Sankey Chart in Excel | Financial Statements канала ChartExpo
Data visualizations Data storytelling Charts Graphs Excel Charts Google Sheets Charts alphabet earning google earning income statement chart income statement sankey diagram financial statement chart chart for financial data Google cloud earning Google Play earning google operating profit google net profit alphabet sankey diagram google sankey diagram Visualize Financial Statements
Комментарии отсутствуют
Информация о видео
15 июля 2024 г. 17:34:02
00:06:26
Другие видео канала