- Популярные видео
- Авто
- Видео-блоги
- ДТП, аварии
- Для маленьких
- Еда, напитки
- Животные
- Закон и право
- Знаменитости
- Игры
- Искусство
- Комедии
- Красота, мода
- Кулинария, рецепты
- Люди
- Мото
- Музыка
- Мультфильмы
- Наука, технологии
- Новости
- Образование
- Политика
- Праздники
- Приколы
- Природа
- Происшествия
- Путешествия
- Развлечения
- Ржач
- Семья
- Сериалы
- Спорт
- Стиль жизни
- ТВ передачи
- Танцы
- Технологии
- Товары
- Ужасы
- Фильмы
- Шоу-бизнес
- Юмор
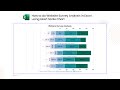
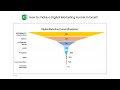
How to create a Tree Diagram in Google Sheets? | Chart For Hierarchical Data | Partition Chart
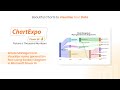
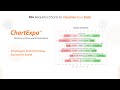
Select Tree Diagram. Select your data. Click “Create chart” button. You can create a Tree Diagram in a few minutes with a few clicks.
A Tree Diagram also called Partition Chart is a type of hierarchical data visualization that breaks down data into different categories or segments, often using nested rectangles. It helps to display large datasets with multiple levels of categories, showing the relative proportion or contribution of each part within the whole.
Some common features of a Tree Diagram include:
• Hierarchical structure: It organizes data into layers, where each subsequent layer represents a breakdown of the previous one.
• Proportionality: The size of each section corresponds to the quantity or value it represents within the dataset.
• Visual clarity: It provides an intuitive understanding of how different segments contribute to the total and their relationships.
Install ChartExpo charts add-on for Google Sheets
https://chartexpo.com/utmAction/MTYrdXQrZ3MrY2V4cG8rNTMzMys=
How to install ChartExpo add-on in Google Sheets video
https://www.youtube.com/watch?v=MxnnkdYB49w
Install ChartExpo charts add-in for Microsoft Excel or Office 365
https://chartexpo.com/utmAction/MTYrdXQreGwrY2V4cG8rNTMzMys=
Explore more charts and visualizations
https://chartexpo.com/?source=YouTube
Video Summary:
This video explains "How to create a Tree Diagram in Google Sheets?". You can use the option of properties to enhance your charts.
Chapters:
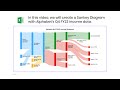
0:09 Introduction to Tree Diagram.
0:40 How to configure a Tree Diagram?
3:09 How to customize a Tree Diagram using properties?
5:15 How to export a Tree Diagram in JPG, PNG, SVG and PDF?
5:46 How to install ChartExpo add-on for Excel & Office 365 video?
#chartexpo #datavisualization #datastorytelling #dataviz #visualization #charts #graphs #spreadsheet #googlesheets #treediagram
Tags:
Custom charts
Advance charts
Professional charts
Data charting
Data visualization tools
Google Sheets graphs
Advance Google Sheets charts
Google Sheets data visualization
Google Sheets Add on
Google Sheets chart tutorial
Google Sheets chart tricks
Impressive Google Sheets charts
Build Modern Google Sheets Charts
Видео How to create a Tree Diagram in Google Sheets? | Chart For Hierarchical Data | Partition Chart канала ChartExpo
A Tree Diagram also called Partition Chart is a type of hierarchical data visualization that breaks down data into different categories or segments, often using nested rectangles. It helps to display large datasets with multiple levels of categories, showing the relative proportion or contribution of each part within the whole.
Some common features of a Tree Diagram include:
• Hierarchical structure: It organizes data into layers, where each subsequent layer represents a breakdown of the previous one.
• Proportionality: The size of each section corresponds to the quantity or value it represents within the dataset.
• Visual clarity: It provides an intuitive understanding of how different segments contribute to the total and their relationships.
Install ChartExpo charts add-on for Google Sheets
https://chartexpo.com/utmAction/MTYrdXQrZ3MrY2V4cG8rNTMzMys=
How to install ChartExpo add-on in Google Sheets video
https://www.youtube.com/watch?v=MxnnkdYB49w
Install ChartExpo charts add-in for Microsoft Excel or Office 365
https://chartexpo.com/utmAction/MTYrdXQreGwrY2V4cG8rNTMzMys=
Explore more charts and visualizations
https://chartexpo.com/?source=YouTube
Video Summary:
This video explains "How to create a Tree Diagram in Google Sheets?". You can use the option of properties to enhance your charts.
Chapters:
0:09 Introduction to Tree Diagram.
0:40 How to configure a Tree Diagram?
3:09 How to customize a Tree Diagram using properties?
5:15 How to export a Tree Diagram in JPG, PNG, SVG and PDF?
5:46 How to install ChartExpo add-on for Excel & Office 365 video?
#chartexpo #datavisualization #datastorytelling #dataviz #visualization #charts #graphs #spreadsheet #googlesheets #treediagram
Tags:
Custom charts
Advance charts
Professional charts
Data charting
Data visualization tools
Google Sheets graphs
Advance Google Sheets charts
Google Sheets data visualization
Google Sheets Add on
Google Sheets chart tutorial
Google Sheets chart tricks
Impressive Google Sheets charts
Build Modern Google Sheets Charts
Видео How to create a Tree Diagram in Google Sheets? | Chart For Hierarchical Data | Partition Chart канала ChartExpo
Data visualizations Data storytelling Charts Graphs Excel Charts Google Sheets Charts tree diagram partition chart group table table widget hierarchical chart multi layers data multi level data group data chart handle missing data interactive chart alternative of sunburst alternative of treemap zoom-in and zoom-out in chart customizeable chart drill down chart detail chart chart for hierarchical data visual clarity hierarchical structure
Комментарии отсутствуют
Информация о видео
26 сентября 2024 г. 10:00:15
00:06:48
Другие видео канала