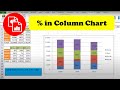
Create a Percent and Value Labels in a 100 percent Stacked column Chart
Step-by-Step tutorial available at:
http://www.exceldashboardtemplates.com/PercentAndValueLabelsStackedChart
Learn how to add percentages and value labels to the data series in an Excel 100% Stacked Column Chart or 100% Stacked Bar Chart.
Видео Create a Percent and Value Labels in a 100 percent Stacked column Chart канала Excel Dashboard Templates
Показать
Комментарии отсутствуют
Информация о видео
12 августа 2013 г. 13:08:54
00:08:36
Другие видео канала
 Create a Column Chart Showing Percentages
 IT Skills: Excel - Display two different sets of data in the SAME chart with Secondary Axis
 Create a Dynamic Excel Chart Using Offset Function
 Stacked & Clustered - 1091 - Learn Excel Podcast
 Create a Pareto Chart
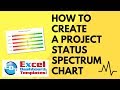 How to Create a Project Status Spectrum Chart in Excel
 Excel 2010 - Percentages
 How-to Stop Excel Charts from Overlapping Second Axis Columns or Bars
 Excel Charts: How To Show Percentages in Stacked Charts (in addition to values)
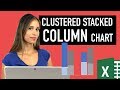 Excel Column Chart - Stacked and Clustered combination graph
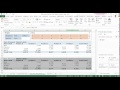 Display data from the Grand Total column of a Pivot Table on a Stacked Pivot Chart
 Excel Charts: Total Values for Stacked Charts in Excel
 Create Waterfall Chart, Auto update Bar Colour and Data labels, Advanced Tutorial
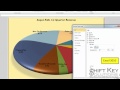 Excel 2010 worksheets and charts - Part 2
 Quickest Way to Select and Align Charts for an Excel Dashboard
 How-to Easily Create a Clustered Stacked Column Chart in Excel
 Excel Magic Trick # 267: Percentage Change Formula & Chart
 Create a Stacked Column or Bar Chart
 Use Excel To Work Out Percentages
 Create a Combination Chart