Interactive Visualizations to Better Understand COVID-19 in Florida: A Guide to Interpretation
My Tableau Public web page that contains the visualization discussed in this video are located at: https://tinyurl.com/COVID19-Jason
---------------------------------------------
I was overwhelmed by the number of friends and family that found it difficult to make sense of data from the official dashboard. As a researcher, I was disappointed not to have the ability to drill down to rates and outcomes by age, considering it is such a critical factor in this pandemic. And, of course, irate at the level of misinformation making it challenging for people to do the right thing. So, I decided to do something about it.
This video is an overview of every table/figure/map currently appearing on my Tableau storyboard (as of July 10). It's long, but hopefully informative.
I am at the mercy of the (mostly) machine-readable data that are publicly available from the Florida Department of Health. But, I try to improve on the digestibility, interactivity, and ease of customization for people interested in what the data on COVID-19 say on a daily basis.
What I continue to promise is no frills, no spin, just data.
Видео Interactive Visualizations to Better Understand COVID-19 in Florida: A Guide to Interpretation канала Dr. Jason L. Salemi
Показать
Комментарии отсутствуют
Информация о видео
Другие видео канала
 What drives the difference between Florida's "case positivity" and "% positivity for new cases"
 Florida Now Reporting Long Overdue Current COVID-19 Hospitalizations: An Initial Look
 COVID-19 Epidemic Curves: The Importance of Understanding the "When" Behind the Curve
 Tracking temporal changes in COVID-19 cases per capita, in Florida, at the zip code level
 Discussion about the "% positivity for new COVID-19 cases" metric reported in Florida
 USF College of Public Health Student Profile: Jason L. Salemi (mid-2000s)
 Time-lapse COVID animation of average daily cases vs. inpatient hospital census
 COVID-19 Antibody Testing: Lump in with People Who Test Positive for the Virus? Why Not?
 A Deeper Look at the Various Ways of Reporting on COVID-19 Deaths in Florida
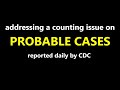 Probable (vs. Confirmed) Cases Reported on the CDC's COVID-19 Tracker
 Either clarifying or obfuscating the test/case positivity data in Florida: I'll let you choose
 Exploration of COVID-19 data from Florida
 San Francisco Half Marathon 2010 (Race Start)
 Dr. Jason Salemi on CNN Newsroom With Jim Acosta 7/26/2021
![COVID-19 deaths based on when they occur vs. when they are reported [here we go again]](https://i.ytimg.com/vi/WI7C0mt9pf0/default.jpg) COVID-19 deaths based on when they occur vs. when they are reported [here we go again]
COVID-19 deaths based on when they occur vs. when they are reported [here we go again]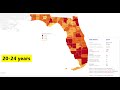 Utility of Having Age-Specific Rates of COVID-19 and Outcomes
 Increased COVID-19 Cases in Florida - A Result of Increased Testing?
 Is It the Changes in Testing Volume that's Driving the Changes in Cases?
 Some numbers (and percentages) surrounding pediatric hospitalizations in Florida
 My take on the extent to which I trust COVID-19 data in Florida