Checking the Normality Assumption in Multiple Regression with Excel 2007
For our inference procedures (t-test, F-tests, confidence intervals, prediction intervals) of multiple regression to be accurate, we assume the population errors come from a normal curve. Thus, if our residuals look like they come from a normal curve, we believe the population errors do, too. Make a dotplot of standardized residuals if you have fairly small sample sizes (say less than 40 observations), and make a histogram of standardized residuals if you have sample sizes that are large (say at least 40). The more mound-shaped the distribution, the more faith we have that the points came from a normal curve.
Видео Checking the Normality Assumption in Multiple Regression with Excel 2007 канала ProfTDub
Видео Checking the Normality Assumption in Multiple Regression with Excel 2007 канала ProfTDub
Показать
Информация о видео
26 ноября 2010 г. 0:39:47
00:07:54
Другие видео канала
 Act Sci 654 - Stepwise in R Commander
 GB-304 Lab Video 7
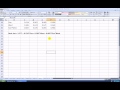 Nonparallel Lines Regression Analysis Using Excel 2007
 GB-304 Lab Video 6
 Parallel Lines Fitted Lines Plot
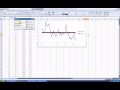 Creating a Random Process Fitted Line Plot in Excel 2007
 GB-304 Lab Video 8
 Assessing the Impact of an Outlier in a Simple Regression Analysis
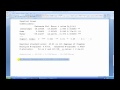 Act Sci 654 - Parallel Lines Regression Using R Commander
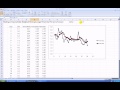 How to Make an Exponentially-Weighted Moving Average Plot in Excel 2007
 Assessing Whether a Time-Series Follows a Random Walk
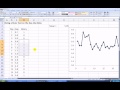 How to Do a Runs Test in MS Excel 2007
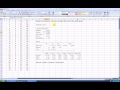 How to Run a Multiple Regression in Excel 2007
 How to Make an Individuals Control in MS Excel 2007
 Doing a T-Test on the Slope Coefficient in Simple Regression
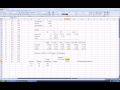 How to Make Predictions from a Multiple Regression Analysis
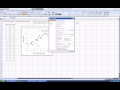 Simple Regression Basics
 How to Run a Quadratic Regression in MS Excel 2007
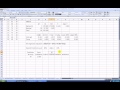 Prediction in Simple Regression
 Creating and Interpreting a Confidence Interval for the Slope of a Simple Regression