How to Make an Individuals Control in MS Excel 2007
The time-series data I analyzed in the video is gas use data (in 100s of cubic feet) of natural gas used at my home on a daily basis over a period of 30 consecutive days. The Individuals Control Chart (or I-Chart) can help determine if the process of gas use is stable (with respect to mean level). If any points exceed the control limits, we conclude the process is not stable.
Видео How to Make an Individuals Control in MS Excel 2007 канала ProfTDub
Видео How to Make an Individuals Control in MS Excel 2007 канала ProfTDub
Показать
Комментарии отсутствуют
Информация о видео
Другие видео канала
 Create a Basic Control Chart
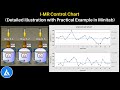 I-MR Control Chart: Illustration with Example
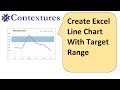 Create an Excel Line Chart With Target Range
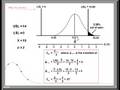 Cpk explained by Professor Cleary
 RUN CHART: What Is a Run Chart? - Video
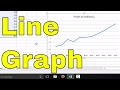 How To Make A Line Graph In Excel-EASY Tutorial
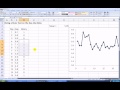 How to Do a Runs Test in MS Excel 2007
 Application of Statistical Analysis: Six Sigma is easy
 Levey Jennings
 How To... Calculate Mean and Standard Deviation in Excel 2010
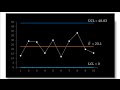 Statistical Process Control | R-Chart (Control Chart for Ranges)
 How to Make a Moving Range Control Chart in MS Excel 2007
 How To... Draw a Basic Control Chart in Excel 2010
 Problem-Solving Techniques #20: Run Charts
 สอน Excel: สอนวิธีการสร้างแผนภูมิควบคุมคุณภาพ (Quality Control or QC Chart)
 Create Control Chart using Excel
 Create a Pareto Chart
 How to Create a Dynamic TARGET LINE in Excel Chart
 XBar-R Control Charts
 Levey-Jennings In Excel