How To Make A Line Graph In Excel-EASY Tutorial
In this video, I show you how to make a line graph in Excel. It's a really simple process, and you can turn any data into a nice-looking line graph. If you want to use your data for a presentation, then you can use this tutorial to create a line graph to impress your audience. A line graph will turn the data into an easy-to-read image that you can use to represent the data in your excel spreadsheet!
CONNECT WITH ME:
Instagram - https://www.instagram.com/mikechimmy/
SUBSCRIBE TO MY CHANNEL:
https://youtube.com/subscription_center?add_user=helpfuldiy
FREE DIY ADVICE EBOOK:
https://gumroad.com/l/vFujc
Disclaimer: Some of the links in this description may be affiliate links. All opinions are my own.
Видео How To Make A Line Graph In Excel-EASY Tutorial канала Helpful DIY
Показать
Комментарии отсутствуют
Информация о видео
Другие видео канала
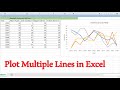 How to graph Multiple lines in 1 Excel plot | Excel in 3 Minutes
 Excel Quick and Simple Charts Tutorial
 Creating a Line Graph in Excel
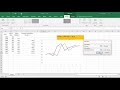 Plot Multiple Lines in Excel
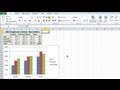 Excel 2010 Tutorial For Beginners #1 - Overview (Microsoft Excel)
 How to make a line graph in Excel (Scientific data)
 Excel Basics - Linear Regression - Finding Slope & Y Intercept
 Creating an XY Scatter Plot in Excel
 Quick tutorial: How to make an Excel chart with two y-axes
 How to Make a Line Graph in Excel - From Simple to Scientific
 Office Tutorials - An Introduction to Graphing (Microsoft Excel 2010)
 MS Excel - Pie, Bar, Column & Line Chart
 How to Make a Line Graph in Excel
 Excel scatter plot tutorial
 How to Make a Graph in Microsoft Excel
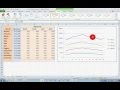 How To... Plot Multiple Data Sets on the Same Chart in Excel 2010
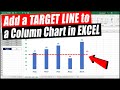 How to Add a Target Line to a Column Chart (2 Methods)
 Graphing two data sets on the same graph with Excel
 Create a cumulative total chart in Excel