How To... Plot Multiple Data Sets on the Same Chart in Excel 2010
Watch this video if you have two or more data sets that you want to plot on the same chart. Even if you have two completely different scales, you can still show your data on a chart side-by-side.
Видео How To... Plot Multiple Data Sets on the Same Chart in Excel 2010 канала Eugene O'Loughlin
Видео How To... Plot Multiple Data Sets on the Same Chart in Excel 2010 канала Eugene O'Loughlin
Показать
Комментарии отсутствуют
Информация о видео
Другие видео канала
 Introduction to Pivot Tables, Charts, and Dashboards in Excel (Part 1)
 Create a Combination Chart in Excel
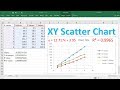 How To Make a X Y Scatter Chart in Excel With Slope, Y Intercept & R Value
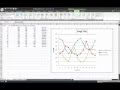 Plotting line graphs in MS Excel
 Excel Magic Trick # 267: Percentage Change Formula & Chart
 Graphing two data sets on the same graph with Excel
 Microsoft Excel: Plotting Multiple Data Series in Excel
 MS Excel - Pie, Bar, Column & Line Chart
 Clustered Stacked Bar Chart In Excel
 How to build Interactive Excel Dashboards
 Plot Two Sets of Data on an X Y Scatter Chart
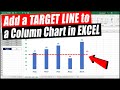 How to Add a Target Line to a Column Chart (2 Methods)
 Weekly Sales chart in Excel
 How to Add MULTIPLE Sets of Data to ONE GRAPH in Excel
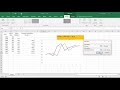 Plot Multiple Lines in Excel
 Pivot Table with Progress Chart and Dashboard
 Two data sets Combine into Single Chart - MS Excel
 How to make a line graph in Excel (Scientific data)
 Graphs in Excel - secondary vertical axis.wmv