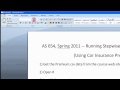
Creating a Random Process Fitted Line Plot in Excel 2007
I use data representing the amount of natural gas used in my home on a daily basis for 30 consecutive days to demonstrate the creation of a random process fitted line plot. I also show calculation of the statistic RMSE (Root Mean Square Error) and use it to represent the quality of fit.
The random process model assumes the data fluctuates randomly around a constant level - which we estimate with the mean of the data we've collected.
Видео Creating a Random Process Fitted Line Plot in Excel 2007 канала ProfTDub
The random process model assumes the data fluctuates randomly around a constant level - which we estimate with the mean of the data we've collected.
Видео Creating a Random Process Fitted Line Plot in Excel 2007 канала ProfTDub
Показать
Комментарии отсутствуют
Информация о видео
5 октября 2010 г. 20:56:16
00:07:16
Другие видео канала
 Act Sci 654 - Stepwise in R Commander
 GB-304 Lab Video 7
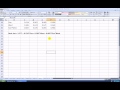 Nonparallel Lines Regression Analysis Using Excel 2007
 GB-304 Lab Video 6
 Parallel Lines Fitted Lines Plot
 GB-304 Lab Video 8
 Assessing the Impact of an Outlier in a Simple Regression Analysis
 Act Sci 654 - Parallel Lines Regression Using R Commander
 Assessing Whether a Time-Series Follows a Random Walk
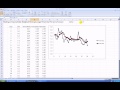 How to Make an Exponentially-Weighted Moving Average Plot in Excel 2007
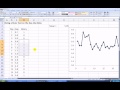 How to Do a Runs Test in MS Excel 2007
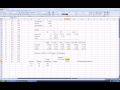 How to Make Predictions from a Multiple Regression Analysis
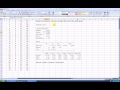 How to Run a Multiple Regression in Excel 2007
 How to Make an Individuals Control in MS Excel 2007
 Doing a T-Test on the Slope Coefficient in Simple Regression
 Checking the Normality Assumption in Multiple Regression with Excel 2007
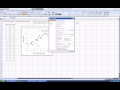 Simple Regression Basics
 How to Run a Quadratic Regression in MS Excel 2007
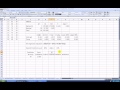 Prediction in Simple Regression
 Creating and Interpreting a Confidence Interval for the Slope of a Simple Regression