How to Make an Exponentially-Weighted Moving Average Plot in Excel 2007
I show how you can create a fitted line plot of this time-series model along with a point forecast and a measure of quality of fit (the root mean square error statistic). I used a technique from a chapter called "Smoothing Data" from Professor Marlene A. Smith's free online "Data Analysis Handbook." Here is a link to her chapters: http://carbon.ucdenver.edu/~mas/coursemtls/dah.htm.
Видео How to Make an Exponentially-Weighted Moving Average Plot in Excel 2007 канала ProfTDub
Видео How to Make an Exponentially-Weighted Moving Average Plot in Excel 2007 канала ProfTDub
Показать
Комментарии отсутствуют
Информация о видео
Другие видео канала
 Lesson 1 - Exponential Moving Averages
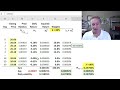 Volatility: Exponentially weighted moving average, EWMA (FRM T2-22)
 Estimate Volatility - Exponentially Weighted Moving Average (EWMA) - FRM
 How To... Forecast Using Exponential Smoothing in Excel 2013
 FRM: Exponentially weighted moving average (EWMA)
 Exponential Moving Average - Technical Analysis
 Linear Regression in Excel for Time Series Data
 Exponentially Weighted Moving Average or Exponential Weighted Average | Deep Learning
 How to do EMA in Excel - Step by Step
 Autoregressive vs. Moving Average: Difference between AR and MA in Microsoft Excel
 How To: Normalize and Standardize Data in Excel
 Mean, Variance and Standard Deviation of a Portfolio with More than Two Stocks
![[STATISTICAL PROCESS CONTROL] Bagan Kendali Exponentially Weighted Moving Average(EWMA)+Demo MINITAB](https://i.ytimg.com/vi/oNF5TkMxjoo/default.jpg) [STATISTICAL PROCESS CONTROL] Bagan Kendali Exponentially Weighted Moving Average(EWMA)+Demo MINITAB
[STATISTICAL PROCESS CONTROL] Bagan Kendali Exponentially Weighted Moving Average(EWMA)+Demo MINITAB Hypothesis Testing correlation (Excel)
 Making a time series graph
 Moving (Rolling) Average in Excel 2016
 ARCH model - volatility persistence in time series (Excel)
 kNN Machine Learning Algorithm - Excel
 Excel Forecasting: Single Exponential Smoothing & Weighted Moving Average Time Series Forecasting
 Making Scatter Plots/Trendlines in Excel