how to calculate NDVI using ArcGis
The Normalized Difference Vegetation Index (NDVI) is a standardized index allowing you to generate an image displaying greenness (relative biomass). This index takes advantage of the contrast of the characteristics of two bands from a multispectral raster dataset—the chlorophyll pigment absorptions in the red band and the high reflectivity of plant materials in the near-infrared (NIR) band.
An NDVI is often used worldwide to monitor drought, monitor and predict agricultural production, assist in predicting hazardous fire zones, and map desert encroachment. The NDVI is preferred for global vegetation monitoring because it helps compensate for changing illumination conditions, surface slope, aspect, and other extraneous factors (Lillesand 2004).
The differential reflection in the red and infrared (IR) bands enables you to monitor density and intensity of green vegetation growth using the spectral reflectivity of solar radiation. Green leaves commonly show better reflection in the near-infrared wavelength range than in visible wavelength ranges. When leaves are water stressed, diseased, or dead, they become more yellow and reflect significantly less in the near-infrared range. Clouds, water, and snow show better reflection in the visible range than in the near-infrared range, while the difference is almost zero for rock and bare soil. The NDVI process creates a single-band dataset that mainly represents greenery. The negative values represent clouds, water, and snow, and values near zero represent rock and bare soil.
Видео how to calculate NDVI using ArcGis канала Made 4 Geek
Показать
Комментарии отсутствуют
Информация о видео
Другие видео канала
 NDVI in ArcGIS
 5 Things To Know About NDVI (Normalized Difference Vegetation Index)
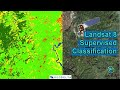 Landsat 8 Image Classification with ArcGIS (Supervised)
 Normalized Difference Vegetation Index NDVI Geogrphic informations system ARCGIS - ESRI - GIS
 Arcgis : Merge the raster datasets /fusionner raster arcgis /Mosaic raster dataset ArcGIS
 Landsat 8 NDVI calculation using ArcGIS 10.2 raster calculator
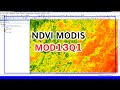 NDVI MODIS | Download and Calculate NDVI MODIS MOD13Q1
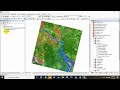 NDVI | Vegetation/Forest Cover Map in ArcGIS
 NDVI area calculation | Calculate area from pixel | NDVI values range
 Calculate NDVI from Sentinel 2 and reclassify in QGIS
 Normalized difference vegetation Index (NDVI)
 How To Add a Locator Map in ArcGis
 Calculating vegetation indices & plant/soil separation with QGIS (Drones in agriculture series, 3/7)
 COMPOSITE LANDSAT 8 IN ARCGIS
 Download Vegetation Health Products (VCI, TCI, VHI) derived from Satellite Remote Sensing data
 Hydrology Tools Map Tutorial – ArcGIS Pro
 QGIS Remote Sensing - Calculate NDVI
 Estimating Land Surface Temperature Landsat 8 | ArcGIS Tutorial | 2020
 How to extract Elevations from DEM to points of sampling grid in ArcGis