Frequency tables and dot plots | Data and statistics | 6th grade | Khan Academy
In this video, we organize data into frequency tables and dot plots (sometimes called line plots).
Practice this lesson yourself on KhanAcademy.org right now:
https://www.khanacademy.org/math/cc-sixth-grade-math/cc-6th-data-statistics/dot-plot/e/creating-frequency-tables?utm_source=YT&utm_medium=Desc&utm_campaign=6thgrade
Watch the next lesson: https://www.khanacademy.org/math/cc-sixth-grade-math/cc-6th-data-statistics/cc-6-statistical-questions/v/understanding-statistical-questions?utm_source=YT&utm_medium=Desc&utm_campaign=6thgrade
Missed the previous lesson? https://www.khanacademy.org/math/cc-sixth-grade-math/cc-6th-data-statistics/dot-plot/v/ways-to-represent-data?utm_source=YT&utm_medium=Desc&utm_campaign=6thgrade
Grade 6th on Khan Academy: By the 6th grade, you're becoming a sophisticated mathemagician. You'll be able to add, subtract, multiply, and divide any non-negative numbers (including decimals and fractions) that any grumpy ogre throws at you. Mind-blowing ideas like exponents (you saw these briefly in the 5th grade), ratios, percents, negative numbers, and variable expressions will start being in your comfort zone. Most importantly, the algebraic side of mathematics is a whole new kind of fun! And if that is not enough, we are going to continue with our understanding of ideas like the coordinate plane (from 5th grade) and area while beginning to derive meaning from data! (Content was selected for this grade level based on a typical curriculum in the United States.)
About Khan Academy: Khan Academy offers practice exercises, instructional videos, and a personalized learning dashboard that empower learners to study at their own pace in and outside of the classroom. We tackle math, science, computer programming, history, art history, economics, and more. Our math missions guide learners from kindergarten to calculus using state-of-the-art, adaptive technology that identifies strengths and learning gaps. We've also partnered with institutions like NASA, The Museum of Modern Art, The California Academy of Sciences, and MIT to offer specialized content.
For free. For everyone. Forever. #YouCanLearnAnything
Subscribe to Khan Academy à ªs 6th grade channel:
https://www.youtube.com/channel/UCnif494Ay2S-PuYlDVrOwYQ?sub_confirmation=1
Subscribe to Khan Academy: https://www.youtube.com/subscription_center?add_user=khanacademy
Видео Frequency tables and dot plots | Data and statistics | 6th grade | Khan Academy канала Khan Academy
Показать
Комментарии отсутствуют
Информация о видео
Другие видео канала
 How To Make a Histogram Using a Frequency Distribution Table
 Statistics intro: Mean, median, and mode | Data and statistics | 6th grade | Khan Academy
 Range, variance and standard deviation as measures of dispersion | Khan Academy
 Comparing dot plots, histograms, and box plots | Data and statistics | 6th grade | Khan Academy
 Two-way frequency tables and Venn diagrams | Data and modeling | 8th grade | Khan Academy
 Mean, Median, and Mode of Grouped Data & Frequency Distribution Tables Statistics
 Stem and Leaf Plots
 How To Make Box and Whisker Plots
 What is probability | Expected Values, Frequency Distribution, Complement
 Intro to Statistical Questions and Dot Plots
 Constructing a Frequency Distribution
 Dot Plots - Line Plots - Data and Graphing - Elementary Math - 4.9A - 4.9B
 The kidney and nephron | Renal system physiology | NCLEX-RN | Khan Academy
 Math Antics - Mean, Median and Mode
 Probability explained | Independent and dependent events | Probability and Statistics | Khan Academy
 Comparing distributions with dot plots (example problem) | 7th grade | Khan Academy
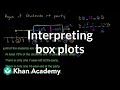 Interpreting box plots | Data and statistics | 6th grade | Khan Academy
 Finding mean, median, and mode | Descriptive statistics | Probability and Statistics | Khan Academy
 How to create a histogram | Data and statistics | 6th grade | Khan Academy