Comparing dot plots, histograms, and box plots | Data and statistics | 6th grade | Khan Academy
Sal solves practice problems where he thinks about which data displays would be helpful in which situations.
Practice this lesson yourself on KhanAcademy.org right now:
https://www.khanacademy.org/math/cc-sixth-grade-math/cc-6th-data-statistics/cc-7th-compare-data-displays/e/comparing-data-displays?utm_source=YT&utm_medium=Desc&utm_campaign=6thgrade
Watch the next lesson: https://www.khanacademy.org/math/cc-sixth-grade-math/cc-6th-data-statistics/cc-6-shape-of-data/v/shapes-of-distributions?utm_source=YT&utm_medium=Desc&utm_campaign=6thgrade
Missed the previous lesson? https://www.khanacademy.org/math/cc-sixth-grade-math/cc-6th-data-statistics/cc-6-mad/v/mean-absolute-deviation-example?utm_source=YT&utm_medium=Desc&utm_campaign=6thgrade
Grade 6th on Khan Academy: By the 6th grade, you're becoming a sophisticated mathemagician. You'll be able to add, subtract, multiply, and divide any non-negative numbers (including decimals and fractions) that any grumpy ogre throws at you. Mind-blowing ideas like exponents (you saw these briefly in the 5th grade), ratios, percents, negative numbers, and variable expressions will start being in your comfort zone. Most importantly, the algebraic side of mathematics is a whole new kind of fun! And if that is not enough, we are going to continue with our understanding of ideas like the coordinate plane (from 5th grade) and area while beginning to derive meaning from data! (Content was selected for this grade level based on a typical curriculum in the United States.)
About Khan Academy: Khan Academy offers practice exercises, instructional videos, and a personalized learning dashboard that empower learners to study at their own pace in and outside of the classroom. We tackle math, science, computer programming, history, art history, economics, and more. Our math missions guide learners from kindergarten to calculus using state-of-the-art, adaptive technology that identifies strengths and learning gaps. We've also partnered with institutions like NASA, The Museum of Modern Art, The California Academy of Sciences, and MIT to offer specialized content.
For free. For everyone. Forever. #YouCanLearnAnything
Subscribe to Khan AcademyÂês 6th grade channel:
https://www.youtube.com/channel/UCnif494Ay2S-PuYlDVrOwYQ?sub_confirmation=1
Subscribe to Khan Academy: https://www.youtube.com/subscription_center?add_user=khanacademy
Видео Comparing dot plots, histograms, and box plots | Data and statistics | 6th grade | Khan Academy канала Khan Academy
Показать
Комментарии отсутствуют
Информация о видео
Другие видео канала
 Dot Plots and Box Plots on the GED
 Frequency tables and dot plots | Data and statistics | 6th grade | Khan Academy
 Box-Plot (Simply explained and create online)
 Skewness - Right, Left & Symmetric Distribution - Mean, Median, & Mode With Boxplots - Statistics
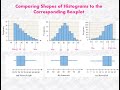 Matching Histograms with Box Plots
 How To Make Box and Whisker Plots
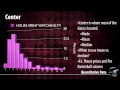 Shape, Center, and Spread
 What is Box Plot - Data Science Terminologies - DataMites Institute
 How to read a box plot (a.k.a. a box-and-whisker plot) - Nick Desbarats
 Interpreting Dot Plots
 Analyzing & Interpreting Box Plots
 Interpreting box plots | Data and statistics | 6th grade | Khan Academy
 BOX AND WHISKER PLOTS EXPLAINED!
 People smoking less over time scatter plot | Regression | Probability and Statistics | Khan Academy
 Dot Plots - Mean, Median, Mode and Range
 How To Create A Box Plot In Excel (Including Outliers)
 #Identifying #mode, #median, #mean, and #range on a dot plot
 Box Plot - 1 | How to draw Box Plot and Outlier | Data Mining | Statistics
 Comparing two Sequences using Dot Plot