Dot Plots - Mean, Median, Mode and Range
In this video we will learn how to calculate the mean, median, mode and range of data from dot plots.
Видео Dot Plots - Mean, Median, Mode and Range канала Travis Nelson
Видео Dot Plots - Mean, Median, Mode and Range канала Travis Nelson
Показать
Комментарии отсутствуют
Информация о видео
Другие видео канала
 Mean median mode and range from a scatter plot
 Math Antics - Mean, Median and Mode
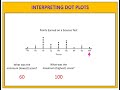 Interpreting Dot Plots
 Frequency tables and dot plots | Data and statistics | 6th grade | Khan Academy
 Dot Plots and Frequency Tables
 Finding mean, median, and mode | Descriptive statistics | Probability and Statistics | Khan Academy
 Finding Mean from a Dot Plot
 Mean, Median, Mode, and Range | Math with Mr. J
 Examining A Dot Plot
 The Mean, Median and Mode Toads
 Stem and Leaf Plot, Range, Mean, Median and Mode - Free Statistics
 finding mean from a histogram
 How To Make Box and Whisker Plots
 Mean, Median, Mode, Range & Standard Deviation
![Learn Graphing, Coordinate Plane, Points, Lines, X-Axis, Y-Axis & Ordered Pairs - [5-7-1]](https://i.ytimg.com/vi/V4W4PLKPeso/default.jpg) Learn Graphing, Coordinate Plane, Points, Lines, X-Axis, Y-Axis & Ordered Pairs - [5-7-1]
Learn Graphing, Coordinate Plane, Points, Lines, X-Axis, Y-Axis & Ordered Pairs - [5-7-1] Shape, Center, and Spread of a Dot Plot
 Analyzing & Interpreting Box Plots
 Mean and Median from Dot Plot (May 1)
 Finding the Median from a Dot Plot
 Dot Plots