Mean, Median, and Mode of Grouped Data & Frequency Distribution Tables Statistics
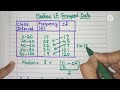
This statistics video tutorial explains how to calculate the mean of grouped data. It also explains how to identify the interval that contains the median and mode of a grouped frequency distribution table. This video contains 2 practice problems.
How To Find The Mean, Median, & Mode Using Excel:
https://www.youtube.com/watch?v=k17_euuiTKw
Ten Side Hustles For College Students
https://www.video-tutor.net/side-hustles.html
My E-Book: https://amzn.to/2UTLsbR
Video Playlists: https://www.video-tutor.net
Homework Help: https://bit.ly/Find-A-Tutor
Subscribe: https://bit.ly/37WGgXl
Support & Donations: https://www.patreon.com/MathScienceTutor
Youtube Membership: https://www.youtube.com/channel/UCEWpbFLzoYGPfuWUMFPSaoA/join
Disclaimer: Some of the links associated with this video may generate affiliate commissions on my behalf. As an amazon associate, I earn from qualifying purchases that you may make through such affiliate links.
Видео Mean, Median, and Mode of Grouped Data & Frequency Distribution Tables Statistics канала The Organic Chemistry Tutor
Показать
Комментарии отсутствуют
Информация о видео
26 января 2019 г. 22:30:01
00:14:34
Другие видео канала
 Understand mean, median, and mode (Grouped data) in 10 minutes
 Calculating Median Using Formula
 How to calculate Median for Grouped Data? | Formula for Median of Grouped Data
 Measure of Central Tendency of Grouped Data for beginners
 Standard Deviation of Grouped Data
 Mean deviation, variance and standard deviation of grouped data.
 Variance and Standard Deviation With Microsoft Excel - Descriptive Statistics
 Mean, median and mode of grouped Data(Lesson 1)
 Math Antics - Mean, Median and Mode
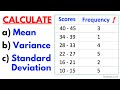 Find the Mean, Variance, & Standard Deviation of Frequency Grouped Data Table| Step-by-Step Tutorial
 Median for grouped data (Descending Order)
 Mean, Median, and Mode (Grouped Data)
 Constructing a Frequency Distribution
 Statistics - Mean, Median & Mode for a grouped frequency data
 Mean, Median, Mode, and Range - How To Find It!
![[Tagalog] How to Calculate Mean, Median, Mode of Grouped Data #Mathematics7 #Fourthquarter](https://i.ytimg.com/vi/y8UdmnY8uJc/default.jpg) [Tagalog] How to Calculate Mean, Median, Mode of Grouped Data #Mathematics7 #Fourthquarter
[Tagalog] How to Calculate Mean, Median, Mode of Grouped Data #Mathematics7 #Fourthquarter How to construct a grouped frequency distribution
 MEAN, MEDIAN AND MODE OF GROUPED DATA || GRADE 10 MATHEMATICS Q4