How to create a histogram | Data and statistics | 6th grade | Khan Academy
Learn how to create histograms, which summarize data by sorting it into buckets.
Practice this lesson yourself on KhanAcademy.org right now:
https://www.khanacademy.org/math/cc-sixth-grade-math/cc-6th-data-statistics/histograms/e/creating-histograms?utm_source=YT&utm_medium=Desc&utm_campaign=6thgrade
Watch the next lesson: https://www.khanacademy.org/math/cc-sixth-grade-math/cc-6th-data-statistics/histograms/v/interpreting-histograms?utm_source=YT&utm_medium=Desc&utm_campaign=6thgrade
Missed the previous lesson? https://www.khanacademy.org/math/cc-sixth-grade-math/cc-6th-data-statistics/cc-6-statistical-questions/v/understanding-statistical-questions?utm_source=YT&utm_medium=Desc&utm_campaign=6thgrade
Grade 6th on Khan Academy: By the 6th grade, you're becoming a sophisticated mathemagician. You'll be able to add, subtract, multiply, and divide any non-negative numbers (including decimals and fractions) that any grumpy ogre throws at you. Mind-blowing ideas like exponents (you saw these briefly in the 5th grade), ratios, percents, negative numbers, and variable expressions will start being in your comfort zone. Most importantly, the algebraic side of mathematics is a whole new kind of fun! And if that is not enough, we are going to continue with our understanding of ideas like the coordinate plane (from 5th grade) and area while beginning to derive meaning from data! (Content was selected for this grade level based on a typical curriculum in the United States.)
About Khan Academy: Khan Academy offers practice exercises, instructional videos, and a personalized learning dashboard that empower learners to study at their own pace in and outside of the classroom. We tackle math, science, computer programming, history, art history, economics, and more. Our math missions guide learners from kindergarten to calculus using state-of-the-art, adaptive technology that identifies strengths and learning gaps. We've also partnered with institutions like NASA, The Museum of Modern Art, The California Academy of Sciences, and MIT to offer specialized content.
For free. For everyone. Forever. #YouCanLearnAnything
Subscribe to Khan Academy à ªs 6th grade channel:
https://www.youtube.com/channel/UCnif494Ay2S-PuYlDVrOwYQ?sub_confirmation=1
Subscribe to Khan Academy: https://www.youtube.com/subscription_center?add_user=khanacademy
Видео How to create a histogram | Data and statistics | 6th grade | Khan Academy канала Khan Academy
Показать
Комментарии отсутствуют
Информация о видео
Другие видео канала
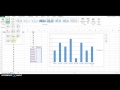 Creating a Histogram with Excel 2013
 What Is And How To Construct Draw Make A Histogram Graph From A Frequency Distribution Table
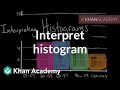 How to interpret a histogram | Data and statistics | 6th grade | Khan Academy
 How To Make a Histogram Using a Frequency Distribution Table
 Mat 144 - How to Create Histogram in Excel.
 Statistics Lecture 2.2: Creating Frequency Distribution and Histograms
 Histograms
 Statistics intro: Mean, median, and mode | Data and statistics | 6th grade | Khan Academy
 Skewness - Right, Left & Symmetric Distribution - Mean, Median, & Mode With Boxplots - Statistics
 MAT 110 Basic Statistics Lesson 1 video 2
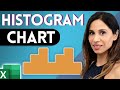 How To Create A Histogram in Excel (& change the bin size)
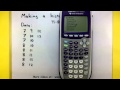 Statistics - How to make a histogram using the TI-83/84 calculator
 How to Make Frequency Table, Histogram, Polygon and Ogive
 Density Curves | Modeling data distributions | AP Statistics | Khan Academy
 Create a Histogram with Excel
 Mode, Median, Mean, Range, and Standard Deviation (1.3)
 Frequency tables and dot plots | Data and statistics | 6th grade | Khan Academy
 What is a Histogram? | Don't Memorise
 Histograms | Applying mathematical reasoning | Pre-Algebra | Khan Academy