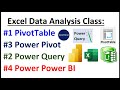
DAME 04: Data Analysis with Excel Worksheet Formulas: 4 Comprehensive examples.
Download files: https://people.highline.edu/mgirvin/AllClasses/348/348/2024/Content/Week06/Video04Files.zip
Alternative link for zipped folder: https://excelisfun.net/files/Video04Files.zip
Free YouTube Data Analysis Class about Microsoft Power Tools in 2024 taught by Excel MVP and Highline College Professor, Mike “excelisfun” Girvin.
In this video learn about when Excel worksheet formulas are the perfect tool for data analysis. An hour lesson in the power of Excel worksheet formulas and when they beat PivotTables, Power Query and Power BI.
Topics:
1. (00:00) Introduction
2. (00:40) 4 scenarios where worksheet formulas are better than other tools.
3. (02:33) Example #1: Enter Data In Worksheet & Need Analysis Off To Side.
4. (03:22) MOD function for hours worked formula
5. (05:19) Line Chart
6. (06:37) 7-Day Moving Average formula AVERAGE, IF, NA and ROWS functions
7. (11:12) TEXT function for day of the week formula
8. (13:00) Dynamic Spilled AVERAGEIFS function to calculate average hours worked per day
9. (14:08) Column chart
10. (15:11) Create Dynamic Spilled Array Single Cell Reporting Formula. Formula to create report that shows Total Hurs by Project Address
11. (16:36) LET function
12. (21:05) Array syntax
13. (22:17) HSTACK and VSTACK functions to join arrays
14. (23:42) Bar chart
15. (25:00) Conditional Formatting for Dynamic Spilled Array formulas
16. (26:53) Test Dynamic Spilled Array formulas with new data
17. (27:25) Example #2: GROUPBY function for single cell reporting. Basics.
18. (31:12) GROUPBY with two row conditions and two values columns
19. (33:23) Create an array syntax with F9 key
20. (34:08) Conditional formatting for GROUPBY with subtotals. Add bold to subtotal row and double-underline for grand total row
21. (36:08) GROUPBY with two functions
22. (37:09) DROP function
23. (37:50) PIVOTBY function
24. (41:02) Example #3: LAMBDA function to create re-usable reporting formula
25. (43:30) Text LAMBDA function
26. (44:28) TAKE function
27. (45:14) Load LAMBDA Function into Defined Name: Name Manager
28. (46:15) Test re-usable function
29. (47:03) Example #4: Build Lambda for Statistical Data Analysis to create a model
30. (51:21) Summary
31. (51:59) Conclusion
Видео DAME 04: Data Analysis with Excel Worksheet Formulas: 4 Comprehensive examples. канала ExcelIsFun
Показать
Комментарии отсутствуют
Информация о видео
Другие видео канала
 Free Data Analysis Class: Intro to PivotTable, Power Query, Power Pivot, Power BI & Big Data
 Introduction to the excelisfun Channel @ YouTube: Excel & Power BI Videos & Free Classes_
 Store Full Table to One Column? Excel Power Query Puts Records in One Cell! Excel Magic Trick1734.
 Power Query Running Count with Grouping & Add Index - Excel Magic Trick 1589
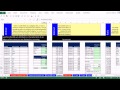 Excel 2013 Statistical Analysis #5 Data Categorical, Quantitative, Nominal, Ordinal, Interval, Ratio
 Spilled Array Formulas Make Excel Life Easy. Compare Two Lists Extract Items Excel Magic Trick 1750
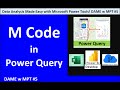 DAME 05: Master Power Query M Code & Become a Data Shaping Ninja (The Secret Behind Data Analysis)
 MSPTDA 12: Using Locale in Power Query Power BI: Import & Append Text Files from Different Countries
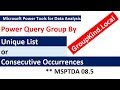 MSPTDA 08.5: Power Query Group By Unique List or Consecutive Occurrences
 MSPTDA 14: Power Pivot Intro #2: Amazing Columnar Database Importing Millions of Rows Data to Excel
 MSPTDA 21: Power Query: Reduce Data Model Size, Transformations to Columnar Database Size
 Office 2013 Class #37: Excel Basics 19: SUMIFS, COUNTIFS: Add & Count with Criteria/Conditions
 Highline Excel 2013 Class Video 05: Cell References: Relative, Absolute & Mixed (8 Examples)
 INDEX & MATCH or XLOOKUP for Lookup Formula in SUMIFS Criteria Argument. Excel Magic Trick 1668.
 E-DAB 01: What is Data Analysis & Business Intelligence?
 E-DAB 09: Power BI Desktop: Data Modeling & Interactive Visualizations
 Highline Excel 2013 Class Video 18: VLOOKUP Function 20 Examples, VLOOKUP Formula, Excel VLOOKUP
 Microsoft Power Tools for Data Analysis: Dashboards & Reports. Class Introduction Video. MSPTDA #01.
 Basic Excel Business Analytics #66: Monte Carlo Simulation for New Product, 3 Uncertain Variables
 E-DAB 07: Data Modeling: VLOOKUP, Power Query or Power Pivot?
 E-DAB 08: Power Pivot: Big Data, Data Modeling, DAX & Dashboards