E-DAB 09: Power BI Desktop: Data Modeling & Interactive Visualizations
Download all files to follow along with video and do homework is zipped folder here: https://people.highline.edu/mgirvin/AllClasses/348/MSPTDA/Content/EDAB/DownloadFilesForEDAB09.zip
To download individual files, visit class web site here: https://people.highline.edu/mgirvin/AllClasses/348/MSPTDA/Content/EDAB/EDAB.htm
Pdf notes: https://people.highline.edu/mgirvin/AllClasses/348/MSPTDA/Content/EDAB/E-DAB-09-PowerBIDesktop.pdf
How to get Free Power BI Desktop:
i. Microsoft Download Page: https://www.microsoft.com/en-us/download/details.aspx?id=45331
1. When you want to update each month, you have to re-download and re-install.
ii. Microsoft Windows Store: https://powerbi.microsoft.com/en-us/desktop/
1. This download will automatically update each month.
This video is an introduction to Data Modeling and Visualization in Power BI Desktop. Learn how to use Power Query to import Excel Files from a Folder. Learn how to build DAX Formulas. Lean how to create an entire Data Model and then build Data Model Visualizations.
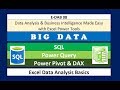
This class : Data Analysis & Business Intelligence Made Easy with Excel Power Tools - Excel Data Analysis Basics = E-DAB Class – Sponsored by YouTube and taught by Mike Girvin, Highline College Instructor, Microsoft Excel MVP and founder of the excelisfun channel at YouTube. This is a free educational resource for people how want to learn about the Basics of Data Analysis and Business Intelligence using Microsoft Power Tools such as, PivotTables, Power Query, Power Pivot, Power BI Desktop and more.
Topics:
1. (00:15) Introduction to Power BI and Interactive Visuals
2. (01:14) Download Files
3. (01:56) Overview of Power BI project
4. (02:38) Excel PowerPivot or Power BI Desktop?
5. (04:20) Power BI History
6. (04:51) Different Versions of Power BI
7. (06:33) Download Free Power BI
8. (07:07) Open Blank File and name “.pbix” file.
9. (07:39) First Look at Power BI Desktop User Interface.
10. (08:45) Import Data into Power BI Desktop. Import many Excel files from a folder. Use Excel.Workbook Function.
11. (15:21) Import Dimension tables from single Excel Workbook.
12. (15:57) Create Relationships between Dimension & Fact Tables
13. (16:11) Create Date Table with DAX Formulas. See the DAX Functions: CALENDAR, MIN, YEAR, DATE, MAX,
14. (21:30) Create DAX Measures for Total Revenue, Total COGS, Total Gross Profit, and Total Units. See the DAX Functions, SUMX, ROUND, RELATED and SUM.
15. (27:20) Hide Tables and Fields that are not used in Reports and Visualizations
16. (28:10) Add new Tabs, Sheets, Pages (all synonyms)
17. (28:26) Create Gross Profit Interactive Visualization
18. (33:29) Create Units Analysis Interactive Visualizations.
19. (33:39) Create Hierarchy
20. (36:17) Summary
Видео E-DAB 09: Power BI Desktop: Data Modeling & Interactive Visualizations канала ExcelIsFun
To download individual files, visit class web site here: https://people.highline.edu/mgirvin/AllClasses/348/MSPTDA/Content/EDAB/EDAB.htm
Pdf notes: https://people.highline.edu/mgirvin/AllClasses/348/MSPTDA/Content/EDAB/E-DAB-09-PowerBIDesktop.pdf
How to get Free Power BI Desktop:
i. Microsoft Download Page: https://www.microsoft.com/en-us/download/details.aspx?id=45331
1. When you want to update each month, you have to re-download and re-install.
ii. Microsoft Windows Store: https://powerbi.microsoft.com/en-us/desktop/
1. This download will automatically update each month.
This video is an introduction to Data Modeling and Visualization in Power BI Desktop. Learn how to use Power Query to import Excel Files from a Folder. Learn how to build DAX Formulas. Lean how to create an entire Data Model and then build Data Model Visualizations.
This class : Data Analysis & Business Intelligence Made Easy with Excel Power Tools - Excel Data Analysis Basics = E-DAB Class – Sponsored by YouTube and taught by Mike Girvin, Highline College Instructor, Microsoft Excel MVP and founder of the excelisfun channel at YouTube. This is a free educational resource for people how want to learn about the Basics of Data Analysis and Business Intelligence using Microsoft Power Tools such as, PivotTables, Power Query, Power Pivot, Power BI Desktop and more.
Topics:
1. (00:15) Introduction to Power BI and Interactive Visuals
2. (01:14) Download Files
3. (01:56) Overview of Power BI project
4. (02:38) Excel PowerPivot or Power BI Desktop?
5. (04:20) Power BI History
6. (04:51) Different Versions of Power BI
7. (06:33) Download Free Power BI
8. (07:07) Open Blank File and name “.pbix” file.
9. (07:39) First Look at Power BI Desktop User Interface.
10. (08:45) Import Data into Power BI Desktop. Import many Excel files from a folder. Use Excel.Workbook Function.
11. (15:21) Import Dimension tables from single Excel Workbook.
12. (15:57) Create Relationships between Dimension & Fact Tables
13. (16:11) Create Date Table with DAX Formulas. See the DAX Functions: CALENDAR, MIN, YEAR, DATE, MAX,
14. (21:30) Create DAX Measures for Total Revenue, Total COGS, Total Gross Profit, and Total Units. See the DAX Functions, SUMX, ROUND, RELATED and SUM.
15. (27:20) Hide Tables and Fields that are not used in Reports and Visualizations
16. (28:10) Add new Tabs, Sheets, Pages (all synonyms)
17. (28:26) Create Gross Profit Interactive Visualization
18. (33:29) Create Units Analysis Interactive Visualizations.
19. (33:39) Create Hierarchy
20. (36:17) Summary
Видео E-DAB 09: Power BI Desktop: Data Modeling & Interactive Visualizations канала ExcelIsFun
Показать
Комментарии отсутствуют
Информация о видео
Другие видео канала
 E-DAB-10: Excel & Power BI Together! Import, Publish and Share Reports & Visualizations
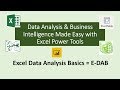 E-DAB 01: What is Data Analysis & Business Intelligence?
 E-DAB 08: Power Pivot: Big Data, Data Modeling, DAX & Dashboards
 GROUP BY in Power BI Query Editor - Do you need all that detail?
 Why you should use DAX Studio with Power BI
 Forecasting in Power BI
 E-DAB 06: The Magic of Power Query to Import, Transform & Load Data
 Creating a simple date table in Power BI
 Microsoft Power Tools for Data Analysis: Dashboards & Reports. Class Introduction Video. MSPTDA #01.
 Power BI Modelling - Part 1 | Star Schema | Reduce Model | Date Table | Power BI Tutorial (43/50)
 The Perfect Data Model for Power BI - Creating a STAR SCHEMA from a Flat File / Excel Table source!
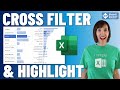 Cross Filter and Highlight Excel Charts like Power BI
 Power BI Tutorial (21/50) - What is Custom Visuals
 How to use the IF & SWITCH DAX Functions in Power BI // Beginners Guide to Power BI in 2021
 📊 How to use Power BI DAX - Tutorial
 Build a Slicer Panel in Power BI and take it to the next level
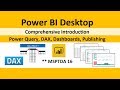 MSPTDA 16: Power BI Desktop Comprehensive Introduction: Power Query, DAX, Dashboards, Publishing
 COMPLETE Power BI Tutorial for Beginners 2022 | GET STARTED NOW!